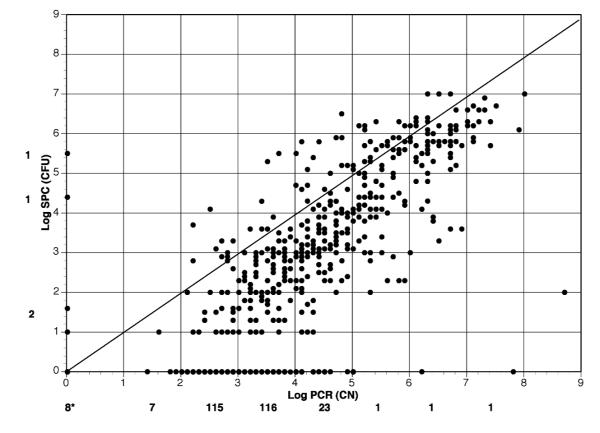
Fig. 3. Comparison of Log SPC (CFU/ml) vs Log qPCR (CN/ml) for All Oral Samples.
Plot of Log (1 + average) of duplicate CFU/ml and CN/ml. Values for each assay are presented as generated from SPC and qPCR assays. Line represents identity line where SPC and qPCR plots would correspond (i.e., intercept 0,0 with slope of 1). 8* is number of data points in which both SPC and qPCR equal zero. Other numbers along the X and Y axis are the number of data points between log values that differ between SPC and qPCR, respectively, where one indicated zero CFU or CN of S. mutans and the other assay indicated >0 S. mutans.

