
Figure 3.
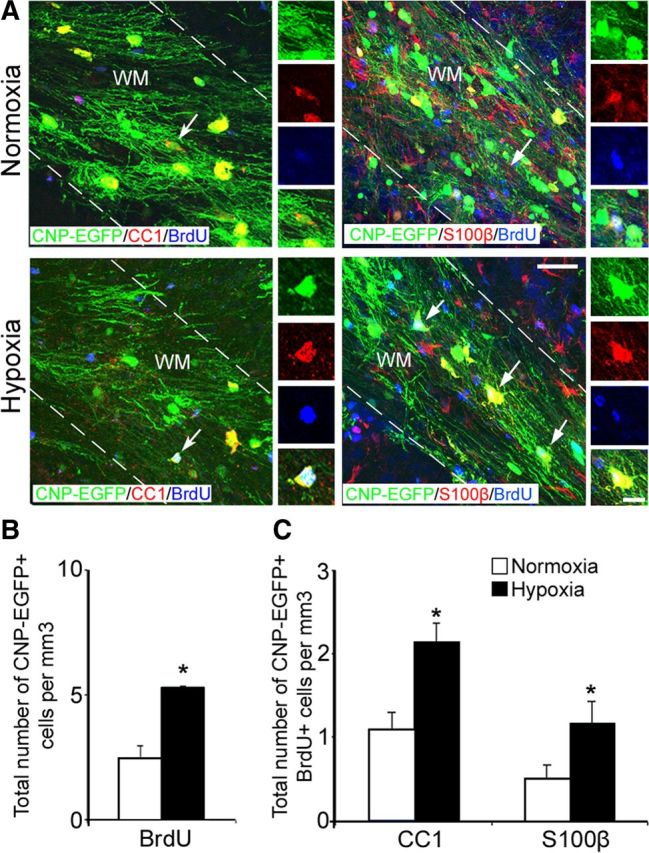
Oligodendrocytes seen at P45 were generated immediately after hypoxia. A, Confocal images from normoxic and hypoxic white matter at P45. CNP-EGFP+BrdU+ cells are colabeled with anti-CC1 and anti-S100β antibodies. The dotted lines bound white matter. The insets magnify cells pointed by white arrows. WM, White matter. Scale bar, 50 μm. The graphs represent total number of proliferating CNP-EGFP+ cells expressing BrdU (B), and CNP-EGFP+BrdU+CC1+ and CNP-EGFP+BrdU+S100β+ cells at P45 (C) (n = 4 brains for each condition and for each antibody; *p < 0.05, t test). Error bars indicate SEM.