
Figure 7.
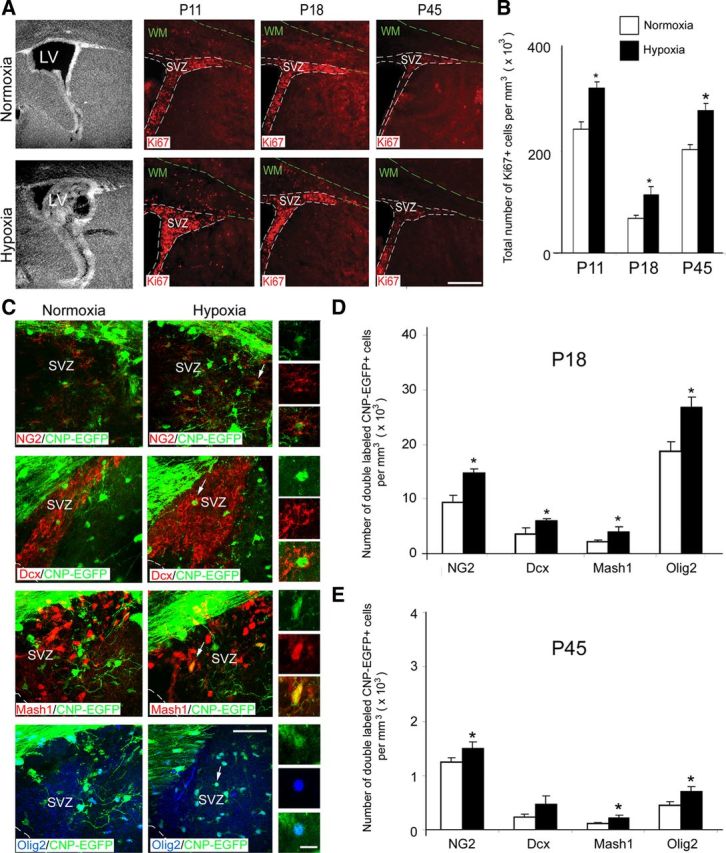
Enhanced cell proliferation in hypoxic SVZ. A, Enlargement of the lateral ventricles was observed at P18 after hypoxia, compared with normoxia. Confocal images show SVZ from normoxic and hypoxic brains at P11, P18, and P45 viewed at 10× magnification. Sections were stained with anti-Ki67 antibody for cell proliferation. After hypoxia, an expansion of the SVZ was observed at P11 and P18. The dotted lines bound the SVZ. WM, White matter. Scale bar, 100 μm (n = 4 brains for each condition). B, Graph represents the total number of Ki67+ cells in the SVZ at P11, P18, and P45. A significant increase in Ki67+ cells was observed in the SVZ during development (n = 4 brains for each condition; *p < 0.05, t test). C, Confocal images of double-labeled cells from the SVZ at P18. CNP-EGFP+ cells labeled with anti-NG2, anti-Dcx, anti-Mash1, and anti-Olig2 antibodies. The insets magnify cells pointed by white arrows. Scale bar, 50 μm. D, Significantly more CNP-EGFP+ cells expressing NG2, Dcx, Mash1, and Olig2 were found at P18 in hypoxic versus normoxic SVZ (n = 4 brains for each condition, and for each antibody; *p < 0.05, t test). E, The SVZ progenitor cell response was still evident at P45, as demonstrated by an increase in the total number of NG2+, Mash1+, and Olig2+ cells at this age (n = 4 brains for each condition, and for each antibody; *p < 0.05, t test). Error bars indicate SEM.