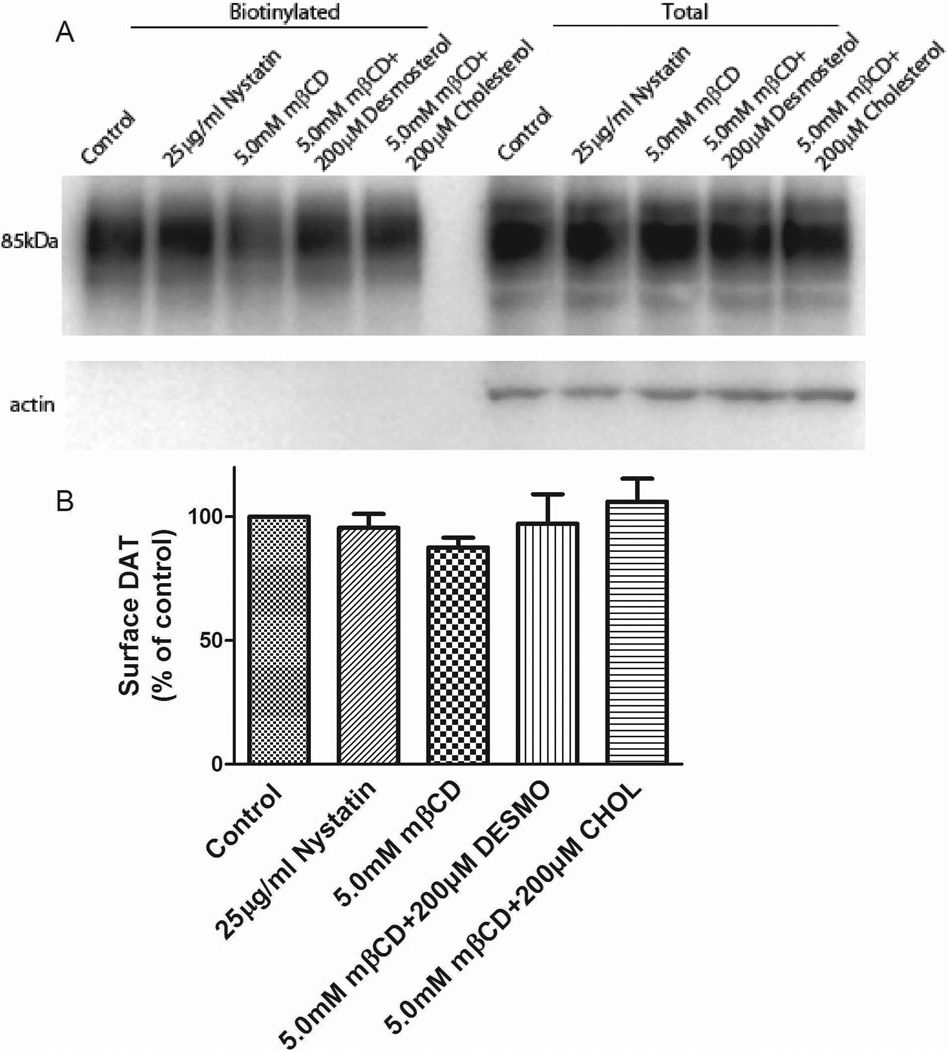
Figure 3.
Surface expression levels of hDAT stably expressed in HEK-293 cells in response to changes in membrane cholesterol. (A) Representative immunoblot showing biotinylated (surface DAT) and total extracts after treatments. (B) Quantification of surface DAT after treatments expressed as percentage of control (means ± SE of four independent experiments).

