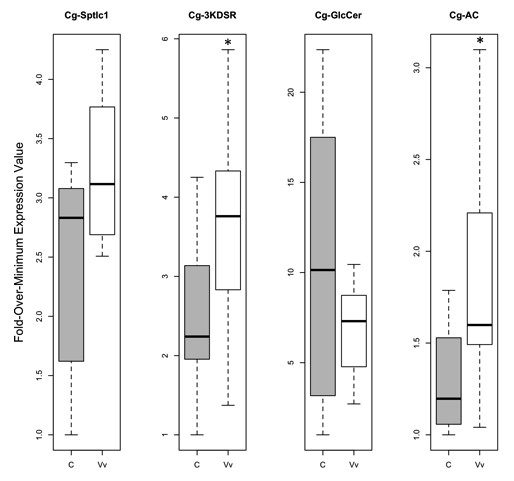
Figure 3.
Expression values in gill tissue for serine palmitoyltransferase-1 (Cg-sptlc1), 3-ketodihydrosphingosine reductase (Cg-3KDSR), ceramide glucosyltransferase (Cg-GlcCer), and acid ceramidase (Cg-AC). Gene expression values for the control (“C”, n = 8) oysters are represented by the gray boxes, while the V. vulnificus-exposed (“Vv”, n = 8) oysters are represented with the white boxes. Boxes represent the spread of the middle 50% of the data with the median shown as the horizontal black line in the box. The dotted lines span the remaining data. An asterisk indicates a significant difference in expression between exposed and control oysters.

