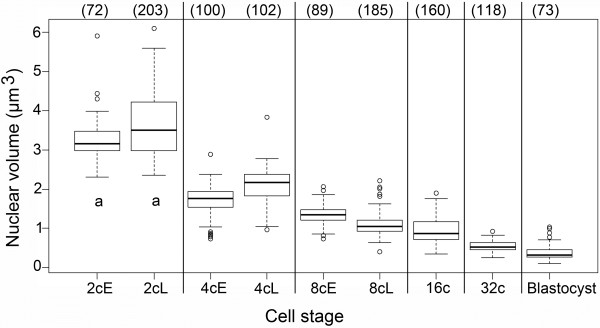
Figure 4.
Quantitative analysis of nuclear volume in preimplantation mouse embryos. Box plots of the nuclear volume at each developmental stage are presented, indicating the smallest observation (sample minimum), the lower quartile, the median value, the upper quartile, and the largest observation. The number of nuclei analyzed at each stage is indicated in brackets above the box plots. At the 2-cell, 4-cell, and 8-cell stages, early (E) and late (L) embryos have been analyzed separately. Differences in mean values between each stage are highly significant, with p < 0.0001 (no subscripts) or p < 0.001 (subscript a, early and late 2-cell stage).

