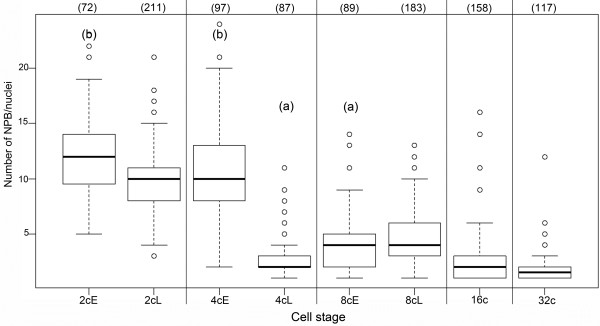
Figure 5.
Quantitative automated analysis of NPBs/nucleoli numbers in preimplantation mouse embryos. Box plots of the number of NPBs/nucleoli in 2-cell through 32-cell stages (early (E) and late (L) embryos have been analyzed separately at the 2-cell, 4-cell, and 8-cell stages). The number of nuclei analyzed at each stage is indicated in brackets above the box plots. Differences in mean values between each stage are highly significant, with p < 0.0001; significant between late 4-cell and 16-cell stages (subscript a), with p = 0.00125; and less significant between early 2-cell and early 4-cell stages (subscript b), with p = 0.0103. The difference between late 2-cell and early 4-cell stages as well as between 16-cell and 32-cell stages is not significant (p > 0.05).

