
Figure 2.
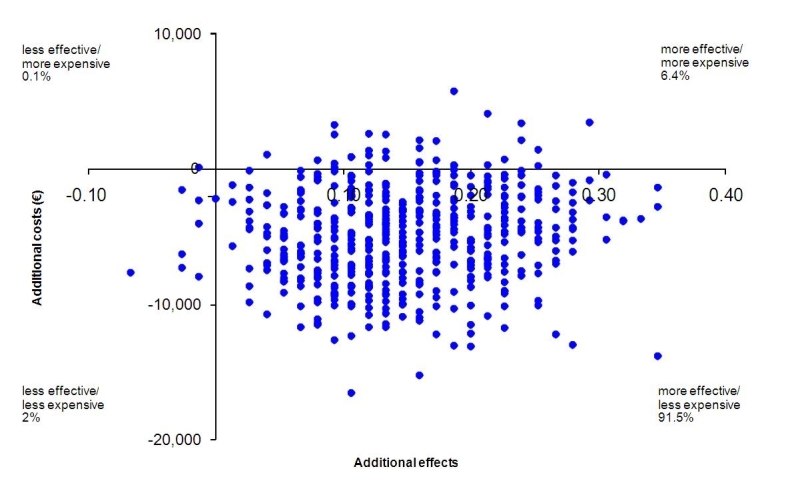
Distribution of bootstrapped incremental cost-effectiveness ratios (ICERs) (n = 2500) on the cost-effectiveness plane, primary analysis.
Official websites use .gov
A
.gov website belongs to an official
government organization in the United States.
Secure .gov websites use HTTPS
A lock (
) or https:// means you've safely
connected to the .gov website. Share sensitive
information only on official, secure websites.
Distribution of bootstrapped incremental cost-effectiveness ratios (ICERs) (n = 2500) on the cost-effectiveness plane, primary analysis.