Figure 6.
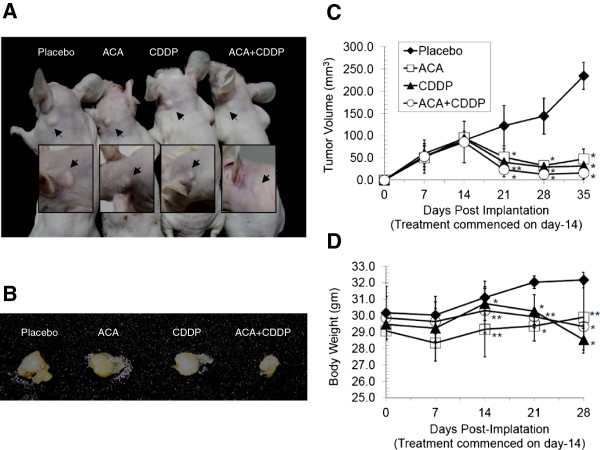
Reduction of tumor volumes when treated with ACA and CDDP in combination on Nu/Nu mice. (A) Photographs of Nu/Nu mice harvested 35 days post-implantation with human oral SCC (HSC-4) xenografts and 21 days post-treatment with various ACA/CDDP treatment regimes. Location of all tumor sites are indicated by closed arrows. (B) Representative photographs (n=5) of dissected oral tumors from different treatment regimes. (C) Tumor volume regression between various treatment groups 35 days post-implantation and 21 days post-treatment. (D) Assessment on body weight loss between various ACA/CDDP treatment groups. Data shown as mean value ± SEM of five replicates per group and 0.9% (w/v) sodium chloride solution was used in placebo groups. Statistically significant differences from placebo groups are shown by (*p ≤ 0.05) and (**p ≤ 0.1).

