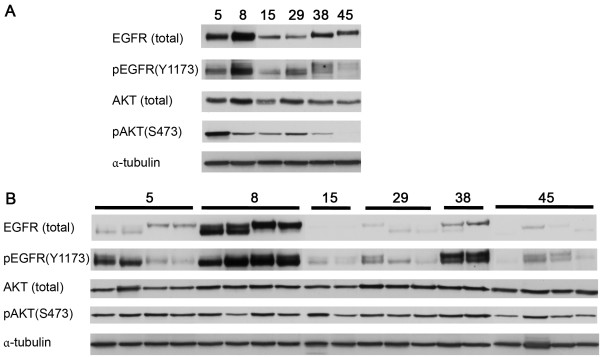
Figure 1.
In vitro and in vivo expression of EGFR, pEGFR, pAKT and AKT in 6 HNSCC lines. Cell lines were both cultured as cell lines (in vitro) and grown as xenograft tumors (in vivo) and expression levels were determined with western blot. Expression of α-tubulin was used as loading control. A) In vitro expression of EGFR, pEGFR, pAKT and AKT. B) In vivo expression of EGFR, pEGFR, pAKT and AKT. Number of harvested tumors ranged from 2 to 4 per cell line.

