Figure 1.

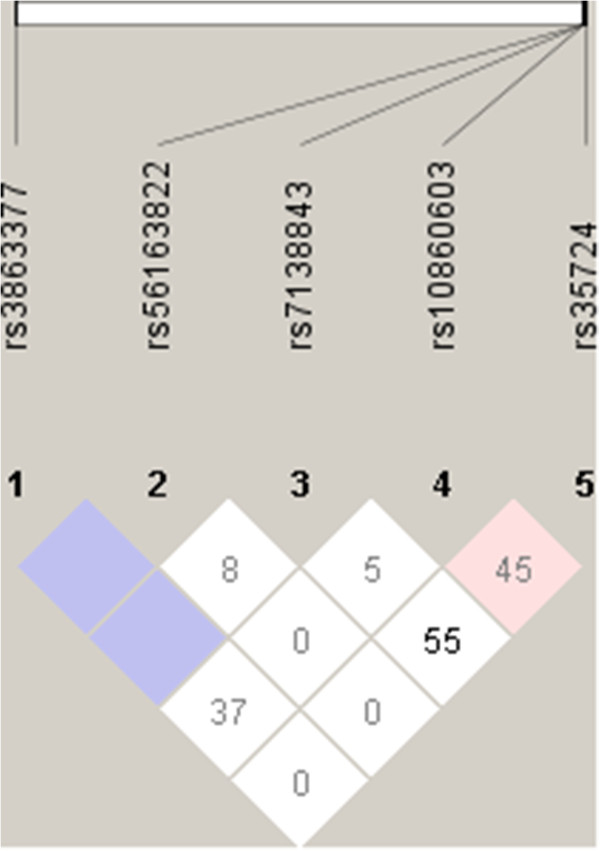
Pairwise linkage disequilibrium calculations between the five NR1H4 SNPs under study in the non-IBD population. A plot with D’ values; Colour scheme: D’ < 1 and LOD < 2, white, D’ = 1 and LOD < 2, blue, D’ < 1 and LOD ≥ 2, pink.

Pairwise linkage disequilibrium calculations between the five NR1H4 SNPs under study in the non-IBD population. A plot with D’ values; Colour scheme: D’ < 1 and LOD < 2, white, D’ = 1 and LOD < 2, blue, D’ < 1 and LOD ≥ 2, pink.