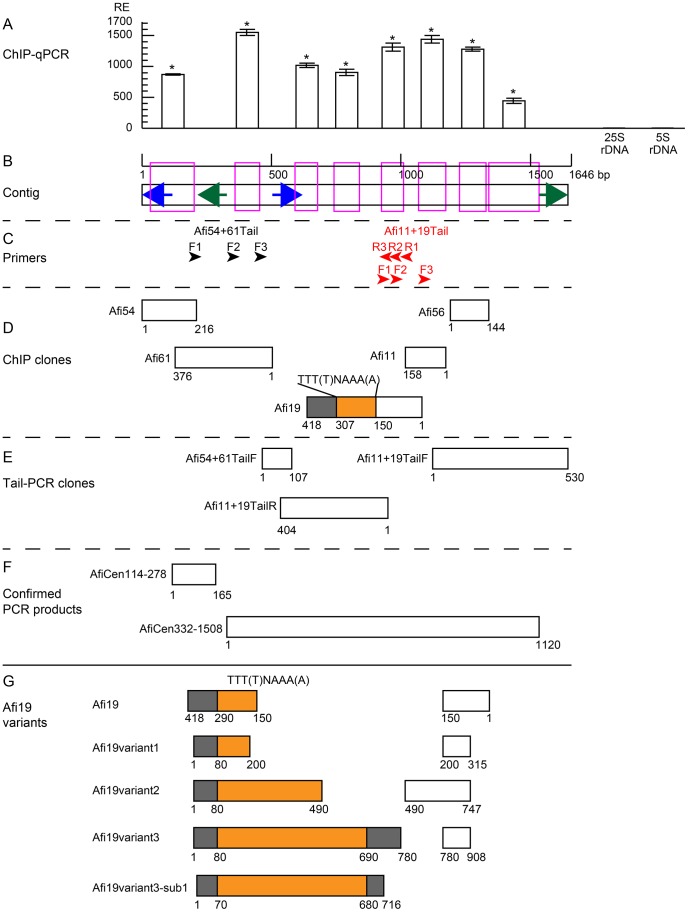
Figure 6. Sequence and qPCR analysis of centromeric DNA sequences of A. fistulosum.
(A) ChIP-qPCR using anti-AfiCENH3 and chromatins from A. fistulosum. The columns and error bars represent the average relative enrichments (RE) and standard error from four independent ChIP experiments, respectively. Amplified regions of each qPCR are indicated by magenta boxes under the column in (B). 25SrDNA and 5SrDNA were used as non-centromeric controls. Statistical significance of differences between 25SrDNA and other sequences were tested using the Tukey’s Honesty Significant Difference test (*P<0.01). (B) A contig made by the ChIP (D) and Tail (E) clones. The blue and green arrows indicate the positions of two inverted repeats. (C) Arrow heads indicate primer position for the Tail-PCR. (D) Position of the ChIP clones. Regions containing non-homologous minisatellite and unique sequences in Afi19 are indicated by orange and gray boxes, respectively. (E) Position of the Tail-PCR clones. (F) Position of confirmed PCR products. (G) Afi19 and its variants. Regions containing non-homologous minisatellite and unique sequences in Afi19 are indicated by orange and gray boxes, respectively.

