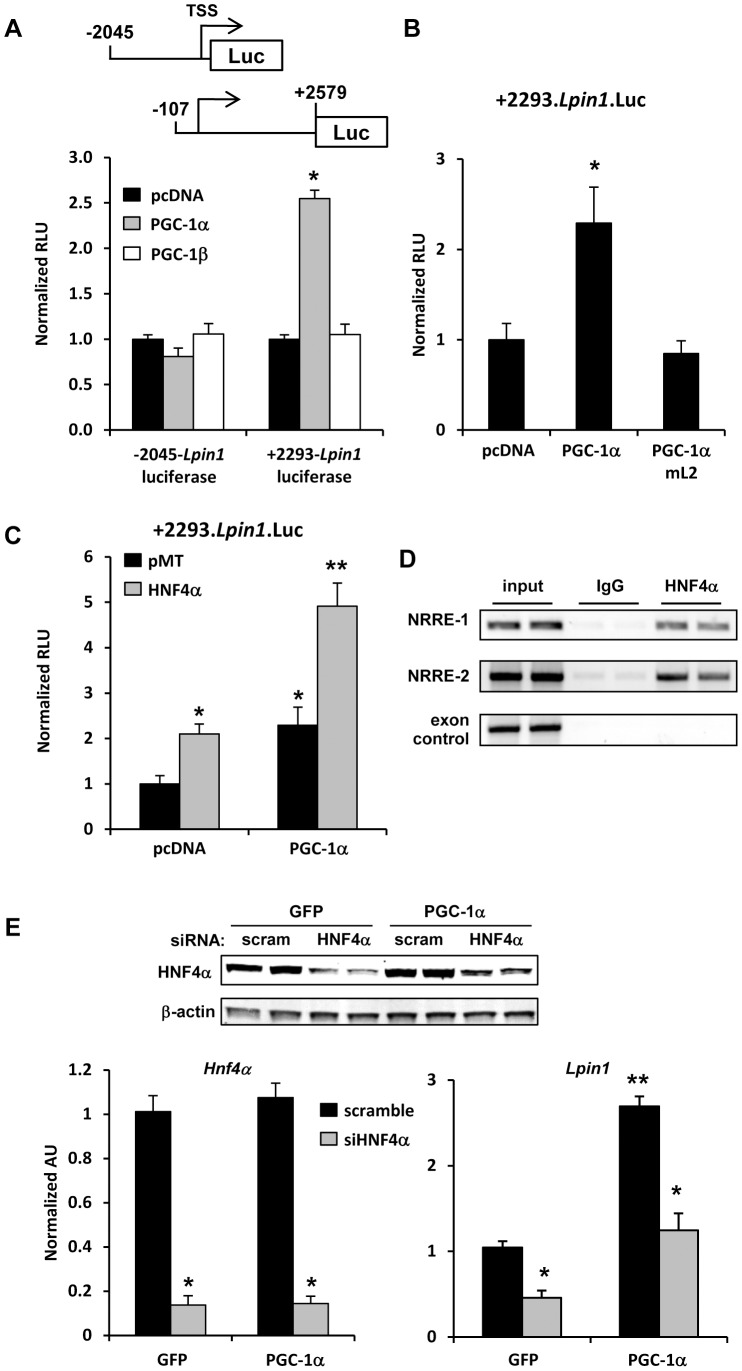
Figure 1. Lipin 1 is a target of HNF4α in HepG2 cells.
[A] The schematic depicts luciferase reporter constructs driven by 2045 bp of 5′ flanking sequence or 2293 bp 3′ from the transcriptional start site of the Lpin1 gene. Graphs depict results of luciferase assays using lysates from HepG2 cells transfected with Lpin1.Luc reporter constructs and cotransfected with PGC-1α or PGC-1β expression constructs as indicated. The vector values are normalized ( = 1.0). The results are the mean of 3 independent experiments done in triplicate. *p<0.05 versus pCDNA control. [B and C] Graphs depict results of luciferase assays using lysates from HepG2 cells transfected with +2293.Lpin1.Luc reporter construct and cotransfected expression constructs expressing WT or mL2 PGC-1α. The results are the mean of 3 independent experiments done in triplicate. *p<0.05 versus pCDNA control. **p<0.05 versus pCDNA control and HNF4α or PGC-1α overexpression alone. [D] The images depict the results of chromatin immunoprecipitation studies using chromatin from mouse hepatocytes infected with adenovirus to overexpress HNF4α. Crosslinked proteins were IP’ed with HNF4α antibody or IgG controls. “Input” represents 0.2% of the total chromatin used in the IP reactions. PCR primers were designed to amplify two regions of the Lpin1 gene promoter containing NRREs or exon 7 (negative control). [E] Inset images depict results of western blotting analyses for the HNF4α and β-actin in HepG2 cells infected with adenovirus to overexpress PGC-1α or GFP (control) and transfected with siRNA to knockdown HNF4α or scramble control siRNA. Graphs depict the expression of HNF4α or lipin 1 mRNA in HepG2 cells infected with adenovirus to overexpress PGC-1α or GFP (control) and transfected with siRNA to knockdown HNF4α or scramble control siRNA (n = 6). *p<0.05 versus scramble control infected with the same adenovirus. **p<0.05 versus all other groups.

