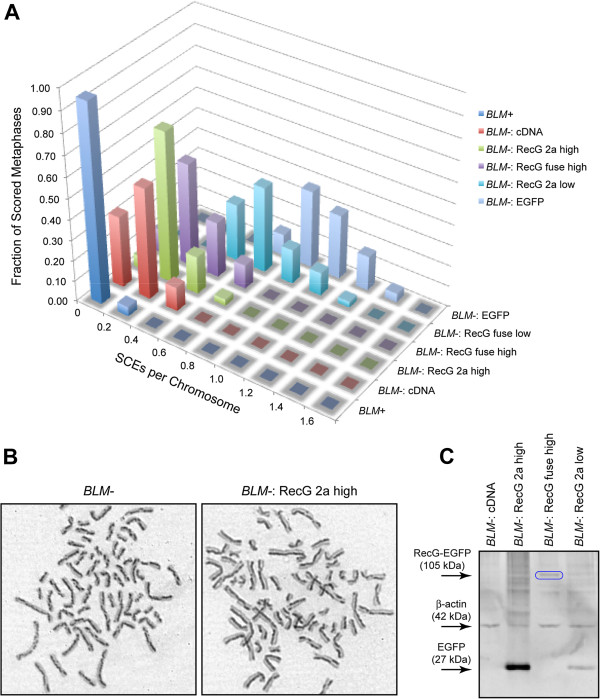
Figure 2.
RecG expression suppresses the BLM-elevated SCE phenotype. 2A) Normalized sister chromatid exchange frequencies. “RecG 2a” denotes cells expressing RecG and EGFP as separate co-translated proteins. “RecG fuse” denotes cells expressing RecG and EGFP together as a fusion protein. 2B) Representative sister chromatid exchange metaphase spreads with sister chromatids differentially stained. The harlequin staining pattern of the BLM- cells is greatly reduced upon expression of RecG. 2C) RecG expression levels. Protein extracts from the indicated cell lines are blotted with an anti-GFP antibody and with anti-β-actin as a loading control. RecG-EGFP fusion proteins (105 kDa) are indicated with blue ovals. EGFP is detected as a proxy biomarker for RecG in the “RecG 2a” co-translated lines. See also Table 1 for EGFP quantitation by flow cytometry.

