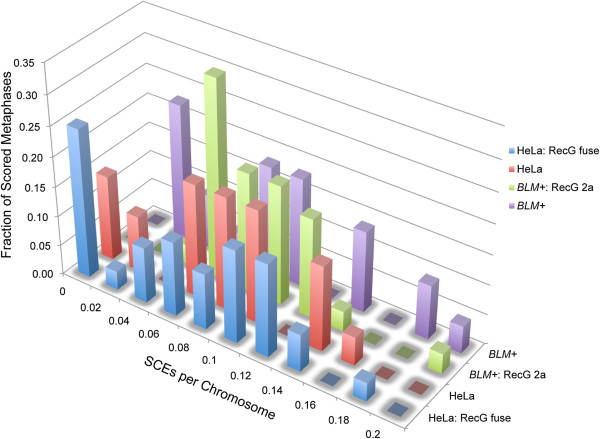
Figure 4.
RecG expression has no effect on SCE levels in cells with normal BLM protein. Normalized sister chromatid exchange frequencies are shown. Note the scale of the x-axis in this figure ranges from 0 to 0.2 for the distribution of SCEs/chromosome in lines with normal BLM function, whereas the scale of the x-axis in Figure 2A ranges from 0 to 2.0 SCEs/chromosome, consistent with the known 10-fold elevation of sister chromatid exchanges in BLM- lines.

