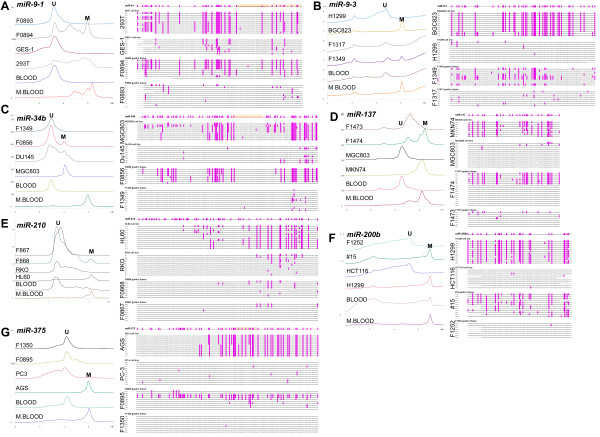
Figure 1.
DHPLC chromatograms and bisulfite sequencing of 7 miR CpG islands in representative cell lines and gastric tissue samples. Both human peripheral blood DNA (BLOOD) and its M.SssI-methylated products (M.BLOOD) were used as controls. All CpG sites in the amplicon of each miR CpG island are also listed above the results of bisulfite sequencing. Each row represents one clone; each pink bar represents a methylated CpG site. The corresponding chromatogram of each sequenced sample (right column) is shown (left column).

