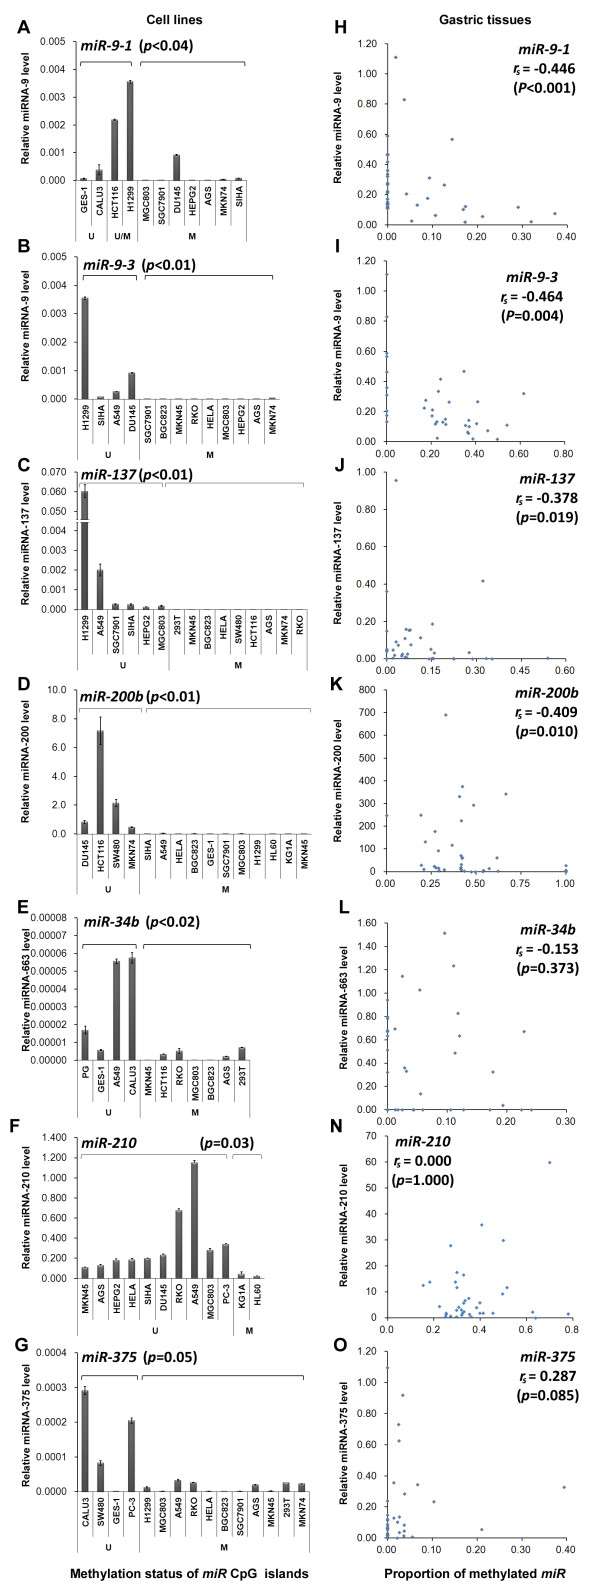
Figure 3.
The relationship between expression level and methylation status of miR genes in human cell lines and gastric tissue samples. (A-G) The correlation analysis between methylation proportion of miRNA CpG islands and their mature miRNA expression levels in the target CpG island methylated and unmethylated human cell lines; (H-P) Expression of miRNAs in 20 paired, fresh gastric carcinoma samples; (U) Target CpG island unmethylated cell lines; (M) Target CpG island methylated cell lines; (U/M) Target CpG island partially methylated cell lines.

