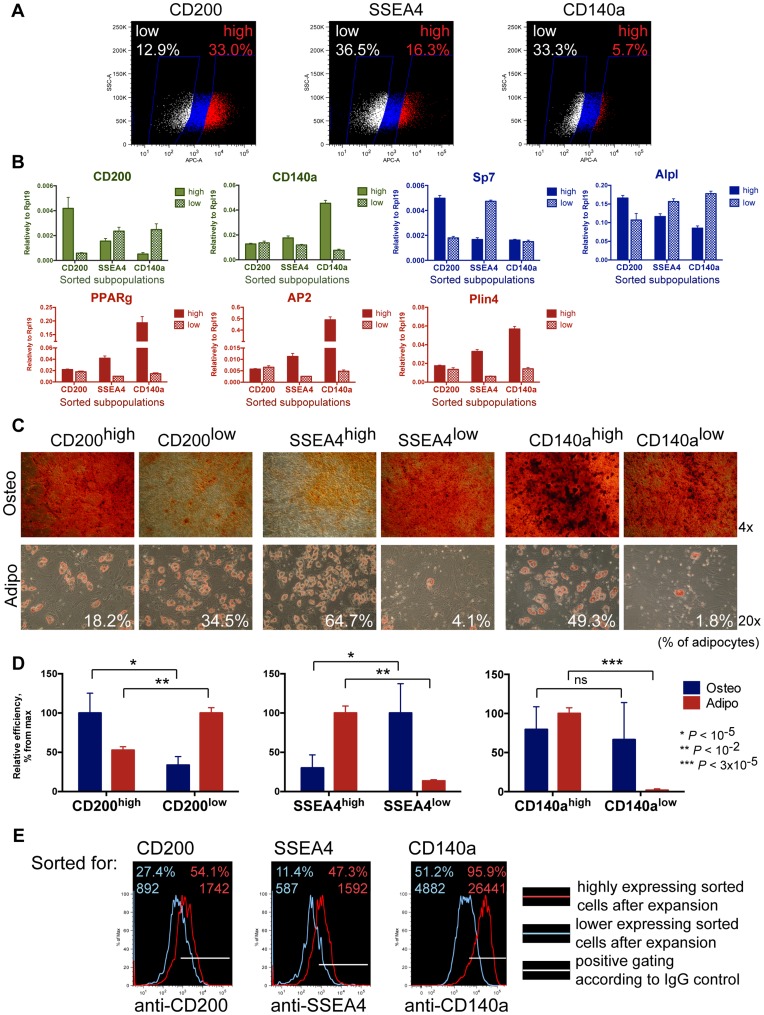
Figure 3. Cellular sorting of bone marrow MSC subsets with different levels of CD200, SSEA4 and CD140a expression.
(A) FACS gates for sorting of MSC subpopulations for high and low expression of CD200, SSEA4 and CD140a. (B) Quantitative RT-PCR for expression of markers used for sorting, CD200 and CD140a (green color), and lineage-specific markers (osteogenic in blue and adipogenic in red), in the cells directly after sorting. (C) The sorted subpopulations were differentiated into osteocytes (stained with Alizarin Red, 4×) and adipocytes (stained with Oil Red, 20×, percent of adipocytes is indicated). (D) Comparison of osteogenic and adipogenic potentials in the sorted MSC subpopulations. Efficiency of osteogenic differentiation was quantified by Alizarin Red extraction and measurement of OD at 490 nm of the eluate, and adipogenic differentiation was assessed by adipocyte counting. High- and low-expressing markers subsets were compared and the percent of differentiation efficiency from the maximal among them is shown. (E) Flow cytometry results of MSC subpopulations for the markers, which were used for sorting. After at least 5 passages in culture the positively sorted cells (red line) maintained elevated level of expression compared to the negatively sorted cells (blue line).

