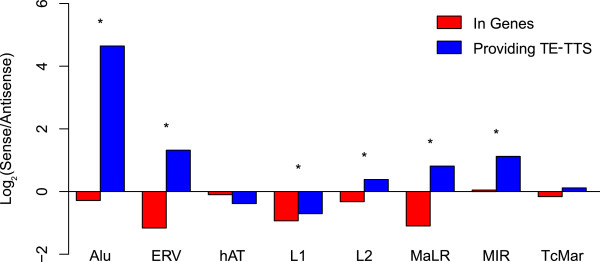
Figure 3.
TE sequences providing transcription termination sites show a strong sense bias. For each TE family, the sense/anti-sense ratio was determined for all intragenic insertion (red) and only for those TEs that provide a TE-TTS (blue). For each TE family, statistical significance levels for the differences in the sense/anti-sense ratios (*P < 0.005) were determined using a chi-squared distribution with df = 1.

