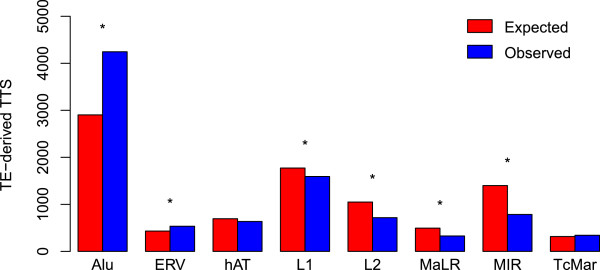
Figure 4.
Alu family sequences provide a greater than expected number of TTS. Expected (red) versus observed (blue) counts of TTS derived from different TE families. Expected counts of TTS derived from each TE family were calculated based on the fraction of intragenic sequences. For each TE family, statistical significance levels for the differences between the expected versus observed counts (*P <10-5) were determined using a chi-squared distribution with df = 1.

