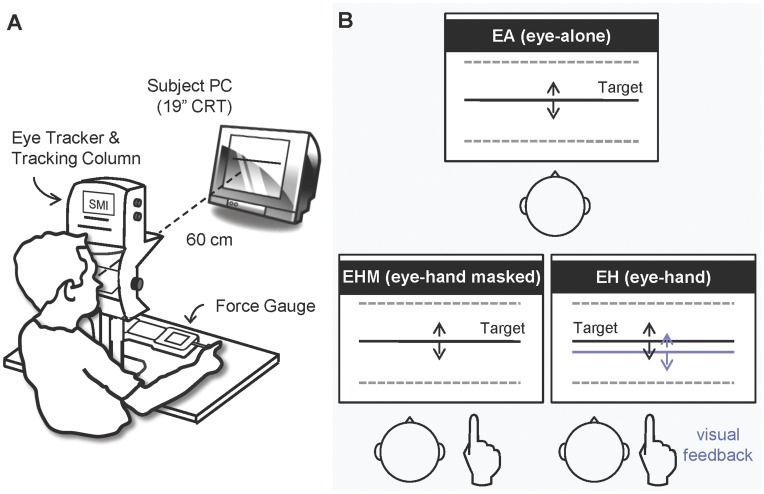
Figure 1. Experimental setup and conditions.
(A) A schematic drawing of the experimental setup and the equipment. (B) Diagrammatic representations of the experimental conditions: EA, EHM, and EH tracking. Subjects tracked the target signal (black solid line) visually and/or manually (see the text for details). Timely visual feedback of the manual force output (blue solid line) was available during EH tracking, but was masked during EHM tracking.

