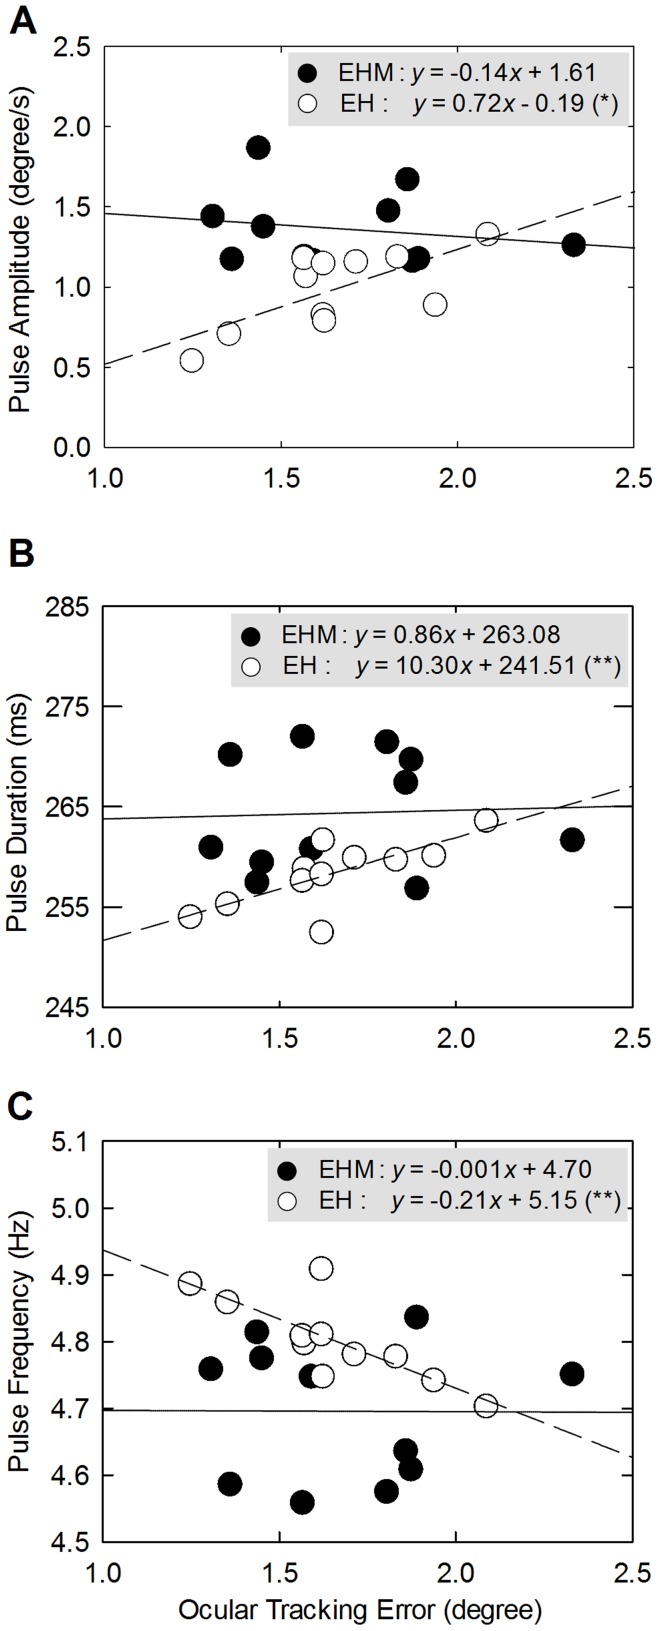
Figure 7. Scatter plots and regression lines of ocular tracking error versus speed pulse metrics.
(A) amplitude, (B) duration, and (C) frequency of speed pulses under the EHM (•) and EH (○) conditions. The symbol x in the equations represents ocular tracking error, and the symbol y represents speed pulse metrics in each plot of (A)-(C). (Significant regression slope: *: P<0.05, **: P<0.01).

