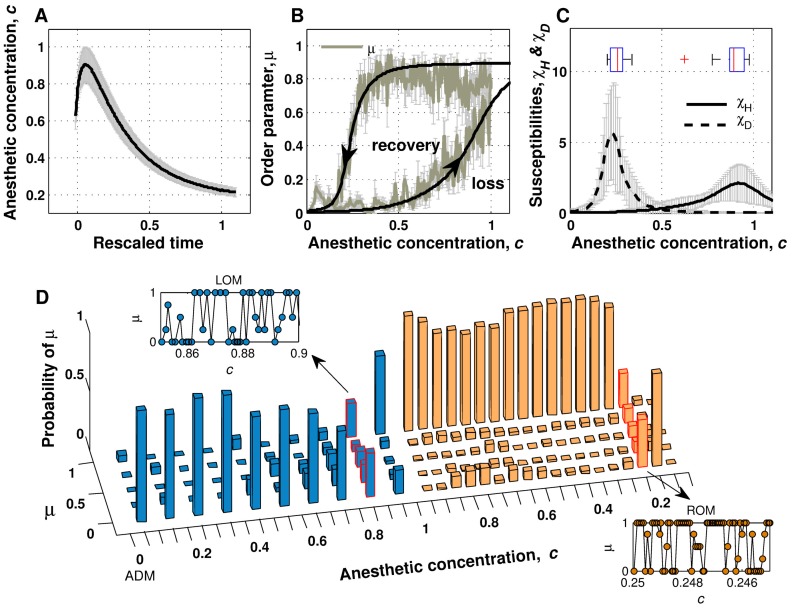
Figure 3. Path-dependent change of brain state and metastable fluctuation during transition.
A. Anesthetic concentration estimated with the three-compartment is plotted with respect to rescaled time, where the moments of tLOM, and tROM correspond to 0 and 1, respectively. Black solid line indicates averaged anesthetic concentration among ten subjects and gray errorbars indicate standard error mean. B. Ensemble average (N = 10) of the order parameter (greenish gray solid) and sigmoidal curve fitting as a function of anesthetic concentration c (black solid). Gray errorbars indicate standard error mean of the order parameter. Arrowheads show the passage of time. C. Ensemble-averaged time courses of hyperpolarizing (solid) and depolarizing (dashed) susceptibilities. Gray errorbars indicate standard error mean of the susceptibilities. The distributions of concentration for maximal susceptibility are shown as the embedded boxplots at the corresponding peaks. D. Representative plot of the recurrence probability of the order parameter for each bin of anesthetic concentration (bin size = 0.1/0.05 for the induction and emergence periods, respectively). Traces of the order parameter at the transitional moments at approximately 0.8 (during induction of anesthesia) and 0.2 (during recovery) are provided as inset figures. The anesthetic concentration of 0.0 at the left side of the axis indicates the moment of drug administration (ADM).

