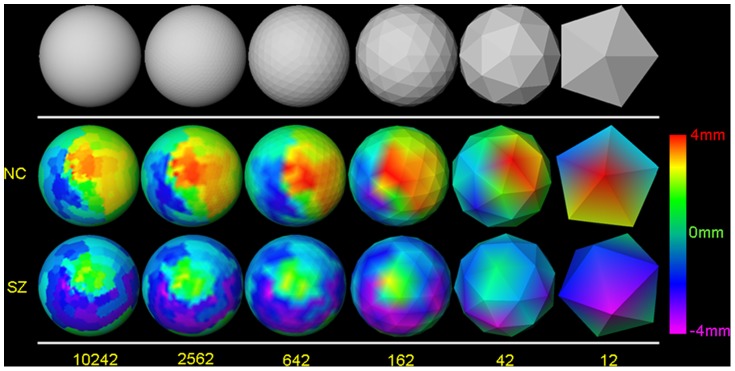
Figure 1. Scaling coefficients at decreasing spatial resolutions.
The numbers of vertices in the triangulated mesh at each level of resolution are indicated at the bottom of the figure. The meshes with 12 and 162 vertices correspond to resolutions 0 and 2, respectively, of the spherical wavelet transformation. Top Row: Approximating a unit sphere at decreasing spatial resolutions. Middle and Bottom Row: Examples of scaling coefficients at decreasing resolutions for local variations in the surface morphological features of the right hippocampus in a representative healthy participant (NC) and a person with Schizophrenia (SZ). The scaling coefficients are color encoded and displayed at the vertices of sphere at the various resolutions. Protrusions with respect to a template surface are encoded in Red and Yellow, and indentations in the surface are encoded in Violet and Blue. Green indicates no difference in the surface. The scaling coefficients were computed by first using conformal mapping to map local variations in surface morphological features onto a unit sphere and then applying the lifted interpolate transformation to the mapped variations. At the lowest resolution, i.e. Resolution 0 of the wavelet transformation, scaling coefficients at the 12 vertices of the icosahedron very coarsely approximate the high-resolution variations in local morphological features. Using scaling coefficients at low spatial resolutions for classification greatly reduces the dimensionality of the feature space.

