
Figure 3.
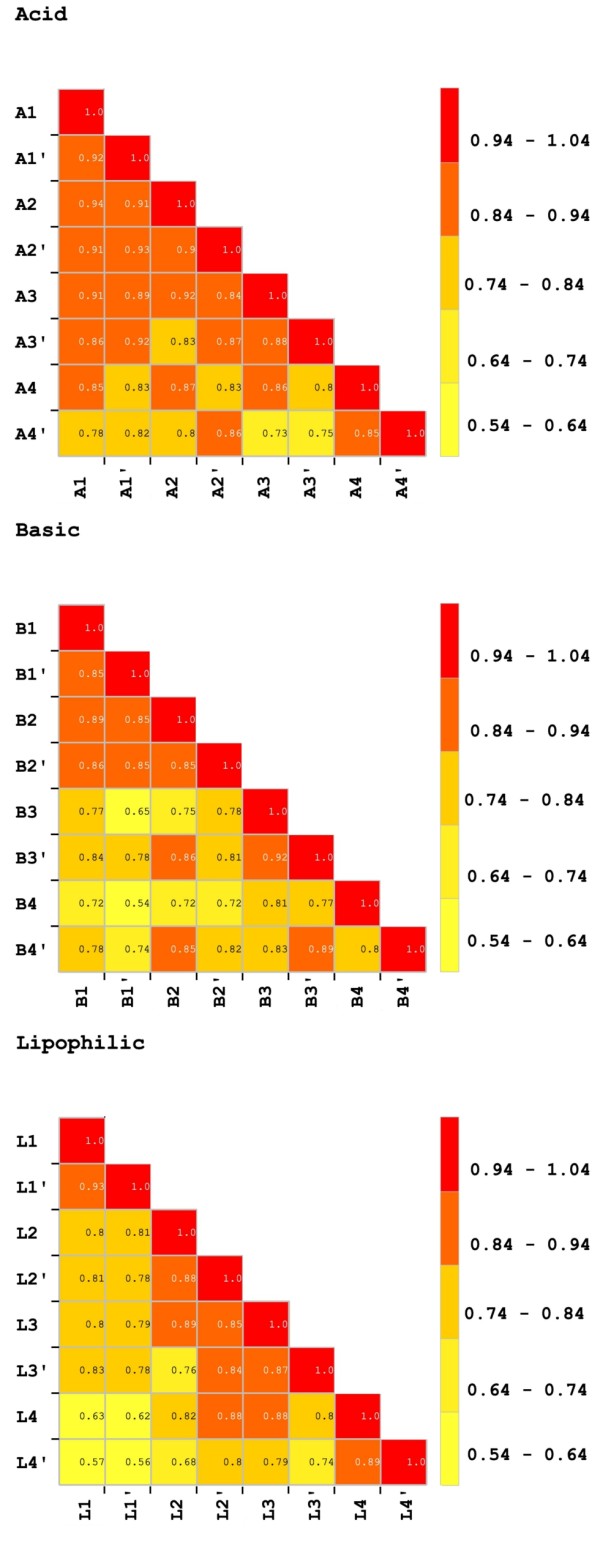
Similarity matrixes. Pearson correlation coefficients compare peptide intensities from LC-MALDI-TOF profiles. Peak intensities of each peptide were compared with the same peptide in all other fractions. Four technical replicates for acid, basic, and lipophilic fractions were evaluated.