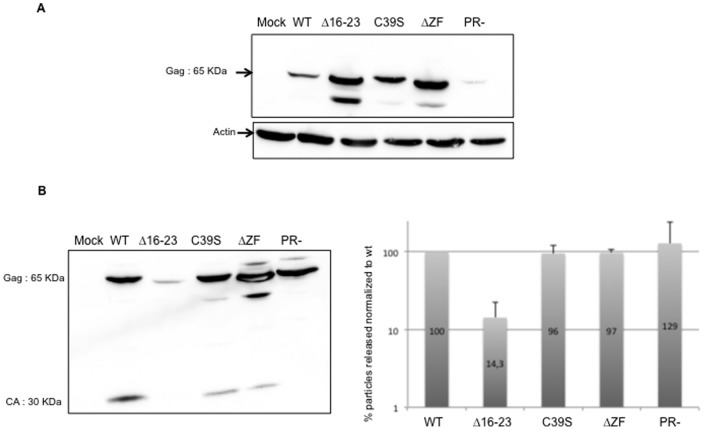
Figure 2. Viral particles produced by MuLV producer cells.
(A) MuLV expression was analysed in cells by immunoblotting with an anti-CA antibody. Actin was probed as a loading control. (B) Mature capsid (CA) and Gag were detected in viral samples. Signals were quantified with ImageQuant software. For each lane, signals corresponding to all the bands were added and normalized to wt level (right part). Error bars indicate SD from at least three independent experiments.

