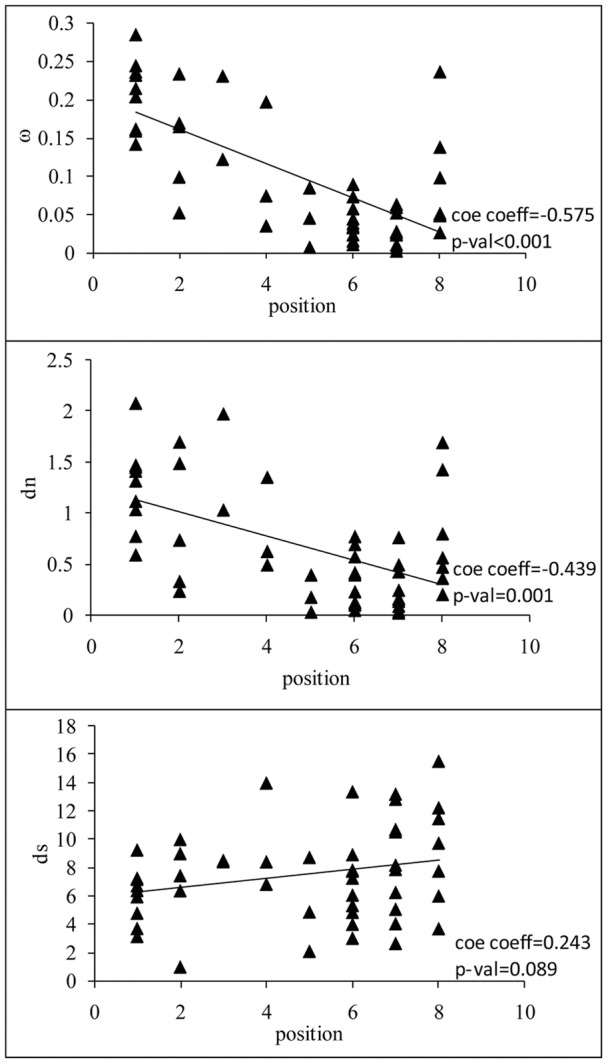
Figure 2. The nonsynonymous/synonymous substitution rate ratio (ω = dn/ds), nonsynonymous substitution rate (dn), and synonymous substitution rate (ds) versus pathway position.

The correlations are significant for ω and dn. This shows that the strength of the purifying selection increases from upstream to downstream.
