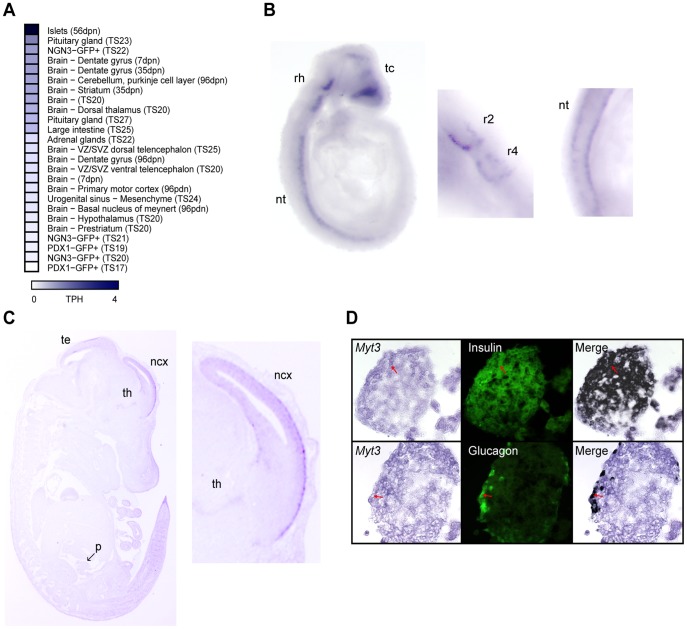
Figure 1. Developmental expression of Myt3 is restricted to specific cell types.
A) A heatmap showing the relative gene expression of Myt3 in different tissues as determined by SAGE analysis of 205 Mouse Atlas of Gene Expression libraries. Tissues with no detected expression are not shown. Myt3 expression was determined by in situ hybridisation of saggital sections of B) E9.5 and C) E14.5 mouse embryos. B) At E9.5 Myt3 expression is restricted to the neural tube, second and fourth rhombomere and the telencephalon. C) Myt3 expression is evident in the tectum, thalamus and neocortex in E14.5 embryos. Myt3 is absent from the pancreas (arrow) at this time point. D) Combination of immunohistochemical analysis and in situ hybridisation demonstrates expression of Myt3 in insulin and glucagon expressing cells. Co-expression in the merged image is indicated by black pseudo-colouring.

