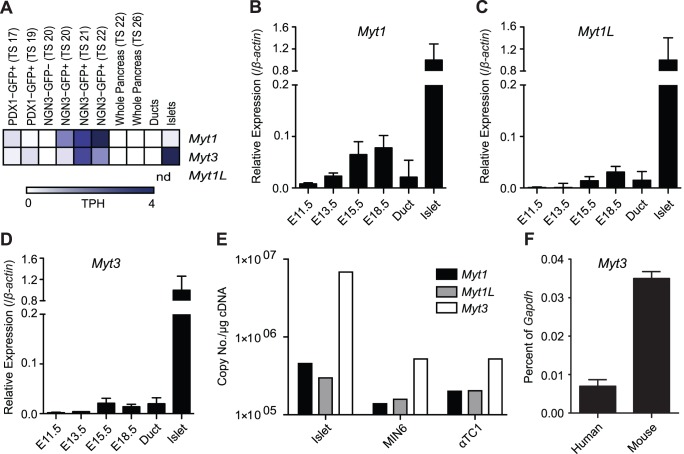
Figure 2. Myt3 is the dominant MYT family member in adult islets.
A) A heatmap showing the relative gene expression of Myt1, Myt1L and Myt3 in pancreatic and endocrine precursor cells, whole pancreas, duct cells and mature islets as determined by analysis of 10 SAGE libraries (www.mouseatlas.org). Expression levels for B) Myt1, C) Myt1L and D) Myt3 in the pancreas as determined by qPCR at various stages of embryonic development as wells as in ductal cells and whole islets from adult mice (8–10 weeks of age). Expression is relative to β-actin and is normalised to expression levels in whole islets. E) Absolute level of Myt1, Myt1L and Myt3 transcripts in islets, MIN6 cells (a β-cell line) and αTc1 cells (an α-cell line) as determined by qPCR. Absolute quantification expressed as number of copies per µg cDNA. F) Expression of Myt3 in human and mouse islets as a percentage of Gapdh expression.

