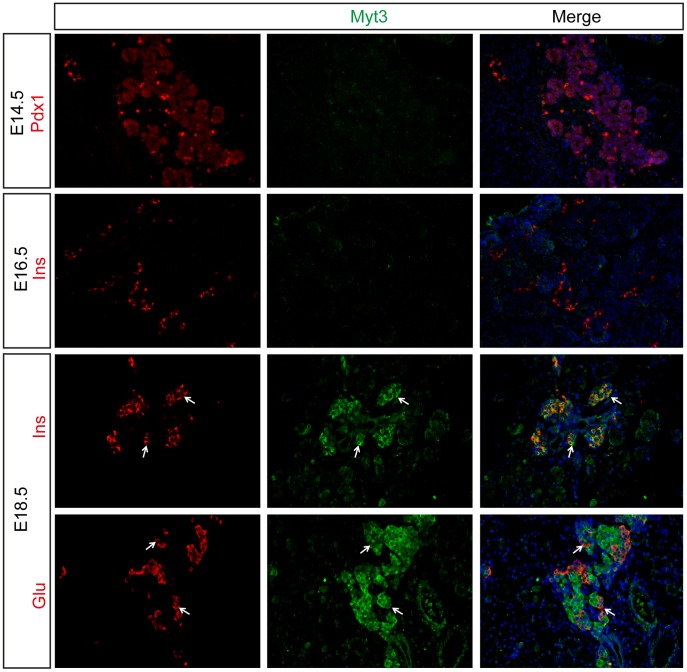
Figure 3. Myt3 protein is detected in endocrine cells from E18.5.
Saggital sections of E14.5, E16.5 and E18.5 pancreata were analysed for expression of Insulin, Glucagon or Pdx1, as indicated (red), and Myt3 (green). Nuclei were stained with Hoechst (blue). Arrows indicate co-localisation of Myt3 with indicated endocrine markers.

