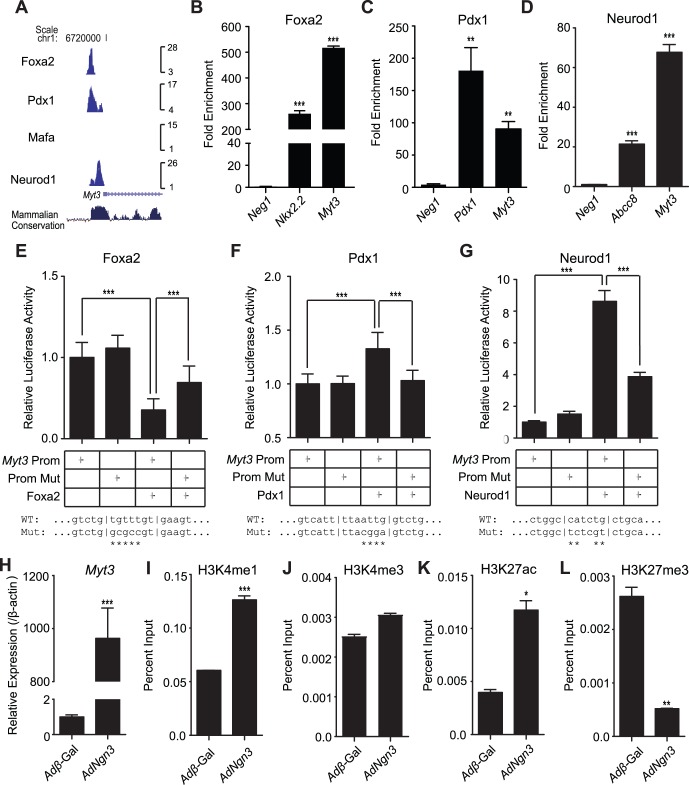
Figure 5. Myt3 expression in islets is under the control of known regulators of β-cell function.
A) A screenshot of the Myt3 promoter region in the UCSC genome browser showing Foxa2, Pdx1, Mafa and Neurod1 ChIP-seq data from islets. Peaks indicate binding sites. ChIP-qPCR was used to validate B) Foxa2, C) Pdx1 and D) Neurod1 binding within the Myt3 promoter region. Nkx2.2, Pdx1 and Abcc8 are positive controls for Foxa2, Pdx1 and Neurod1 binding respectively. E–G) Relative luciferase activity of the indicated luciferase reporter vectors co-transfected with empty vector or with Foxa2, Pdx1 or Neurod1 expressing vectors. Mutant vectors had the indicated transcription factor binding sites altered by site-directed mutagenesis. Wild type and mutant binding site sequences are as indicated. H) Myt3 expression relative to β-actin following treatment of mPAC cells with pAdV-Ngn3. ChIP-qPCR was used to determine I) H3K4me1, J) H3K4me3, K) H3K27ac and L) H3K27me3 histone modifications at the Myt3 promoter. * indicates a statistically significant difference at p≤0.05, ** at p≤0.01, and *** at p≤0.001 based on student’s t-test for luciferase data and a Kruskal-Wallis test with a Dunn’s multiple comparison for ChIP-qPCR data.

