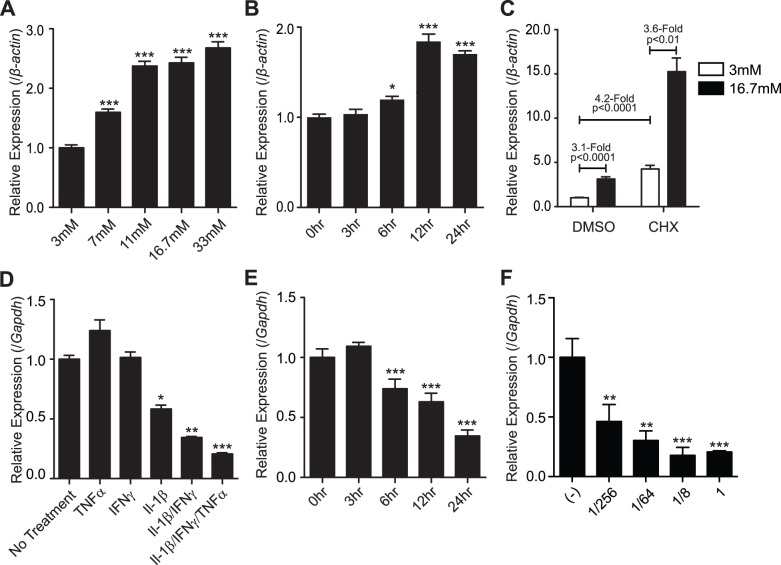
Figure 6. Myt3 expression is sensitive to both glucose and cytokine exposure.
A) Whole cultured islets were treated with the indicated glucose concentrations for 24 hrs, after being pre-incubated for 24 hr in 3 mM glucose. Subsequently qPCR was used to determine the relative expression of Myt3 as compared to β-actin. B) Myt3 expression was determined at the indicated time points following transfer into 16.7 mM glucose. C) Myt3 expression was determined for islets incubated in low or high glucose following treatment with DMSO or cycloheximide (10 µg/ml). Expression is expressed relative to β-actin. D) Whole cultured islets were treated with the indicated cytokine combinations, or E) with triple cytokine mix at the indicated time points. Myt3 expression is expressed relative to Gapdh. F) Whole cultured islets were treated with the indicated cytokine doses (a dose of “1” equals 1000U/ml INFγ, 17.5 ng/ml IL-1β and 10 ng/ml of TNFα) for 24 hours. Subsequently qPCR was used to determine the relative expression of Myt3. Expression is expressed relative to Gapdh. * indicates a statistically significant difference at p≤0.05, ** at p≤0.01, and *** at p≤0.001, based on student’s t-test.

