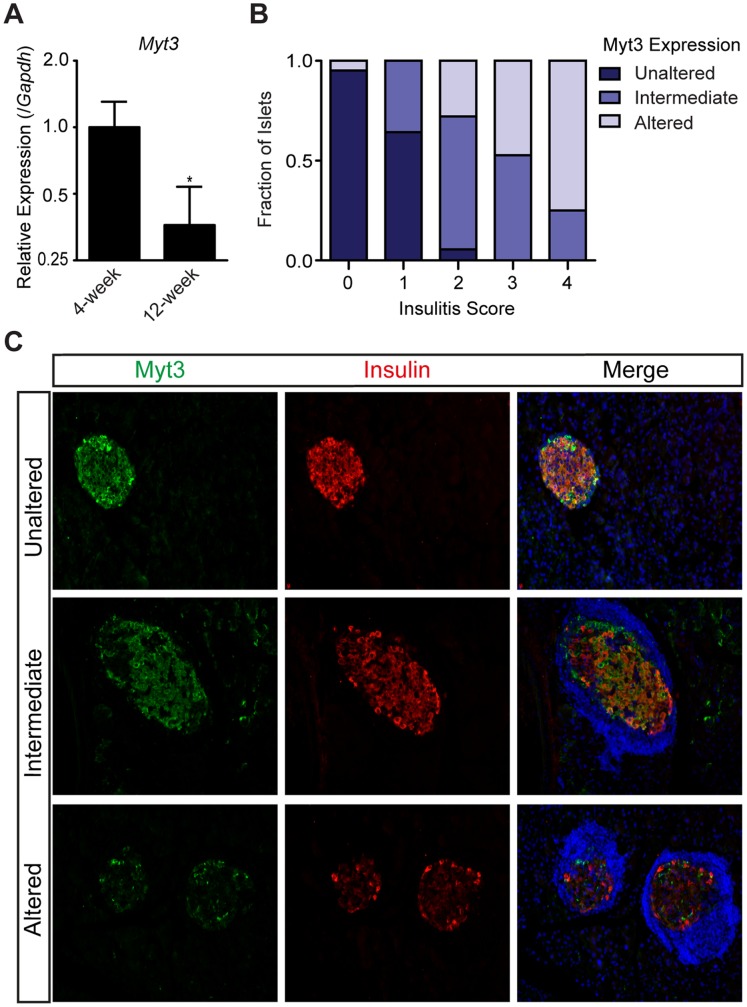
Figure 7. Exposure of islets to cytokines in a mouse model of T1D decreases Myt3 expression.
A) RNA was isolated from whole pancreas of female 4-week and 12-week old NOD mice and Myt3 expression was determined relative to Gapdh. B) Insulitis levels and Myt3 expression in islets were scored by analysing sections from 12-week old NOD mice. C) Representative images of NOD sections showing Myt3 (green) and Insulin (red) expression in islets that are unaltered, intermediately altered and altered. Nuclei were stained with Hoechst (blue). * indicates a statistically significant difference at p≤0.05 based on student’s t-test.

