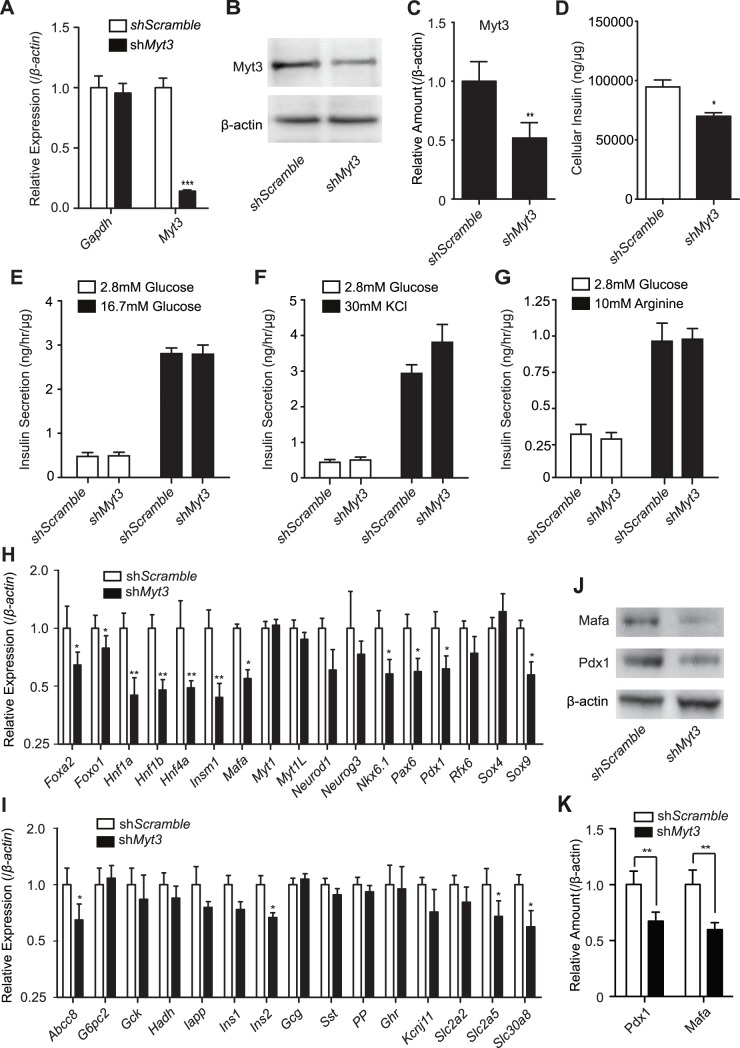
Figure 8. Myt3 regulates insulin content and gene expression in β-cells.
Islets were transduced with adenoviruses expressing shRNA’s targeting Myt3 or a scrambled sequence. A) Myt3 expression was determined relative to β-actin. Gapdh was used as a control for off target effects of the virus. B) Western blot analysis of Myt3 and β-actin protein levels in islets. C) Results of the densitometry of triplicate western blot analyses from B relative to β-actin. Ex vivo islets were transduced as above and D) cellular insulin content and insulin secretion induced with E) 16.7 mM Glucose, F) 30 mM KCl or G) 10 mM Arginine were determined 48 hrs later by Insulin ELISA. qPCR was used to determine the relative expression of H) transcription factors and cofactors and I) Genes involved in β-cell function/physiology as compared to β-actin. J) Western blot analysis of Mafa, Pdx1, and β-actin protein levels. K) Results of the densitometry of triplicate western blot analyses from J relative to β-actin. * indicates a statistically significant difference at p≤0.05, ** at p≤0.01, *** at p≤0.001 based on students t-test.

