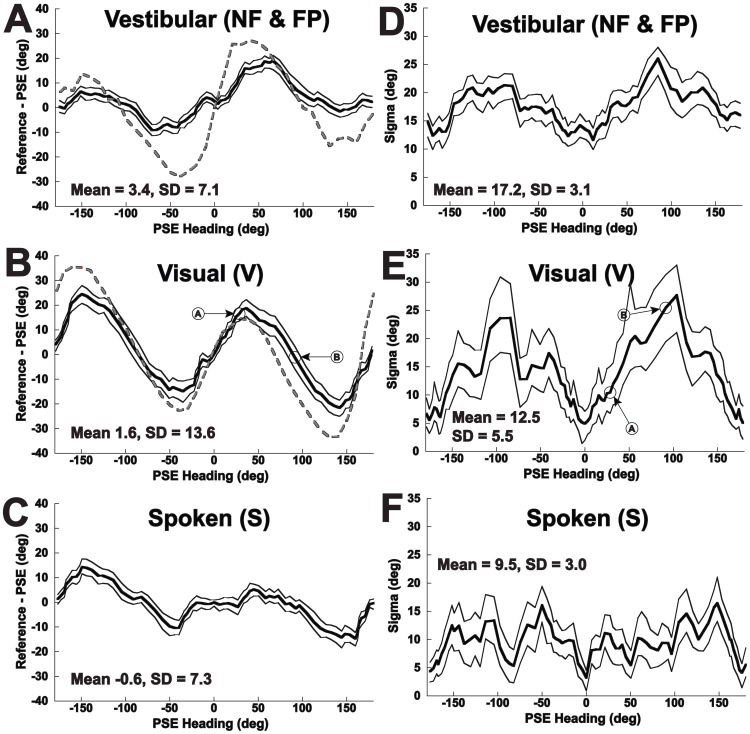
Figure 4. Direction specific bias (panels A–C) and precision (sigma, panels D–F) for perceived heading across subjects.
The results are qualitatively similar to those in Fig. 1, but calculated using the method in Fig. 3. The previously predicted performance based on a PVD model [8] is shown as a red dashed line for the vestibular and visual conditions. The thick line represents the mean value, and the two thin lines represent the 95% CI based on 100 fits with resampled data in each iteration. Panel A: Vestibular motion. Panel B: Visual motion (optic flow). The data points shown calculated in Fig. 3A&B are marked with arrows. Panel C: The subject orients a dial based on a spoken heading. Panel D: Precision for the vestibular condition. Panel E: Precision for the visual stimulus, points calculated in Fig. 3A&B are marked. Panel F: Precision for the spoken condition.

