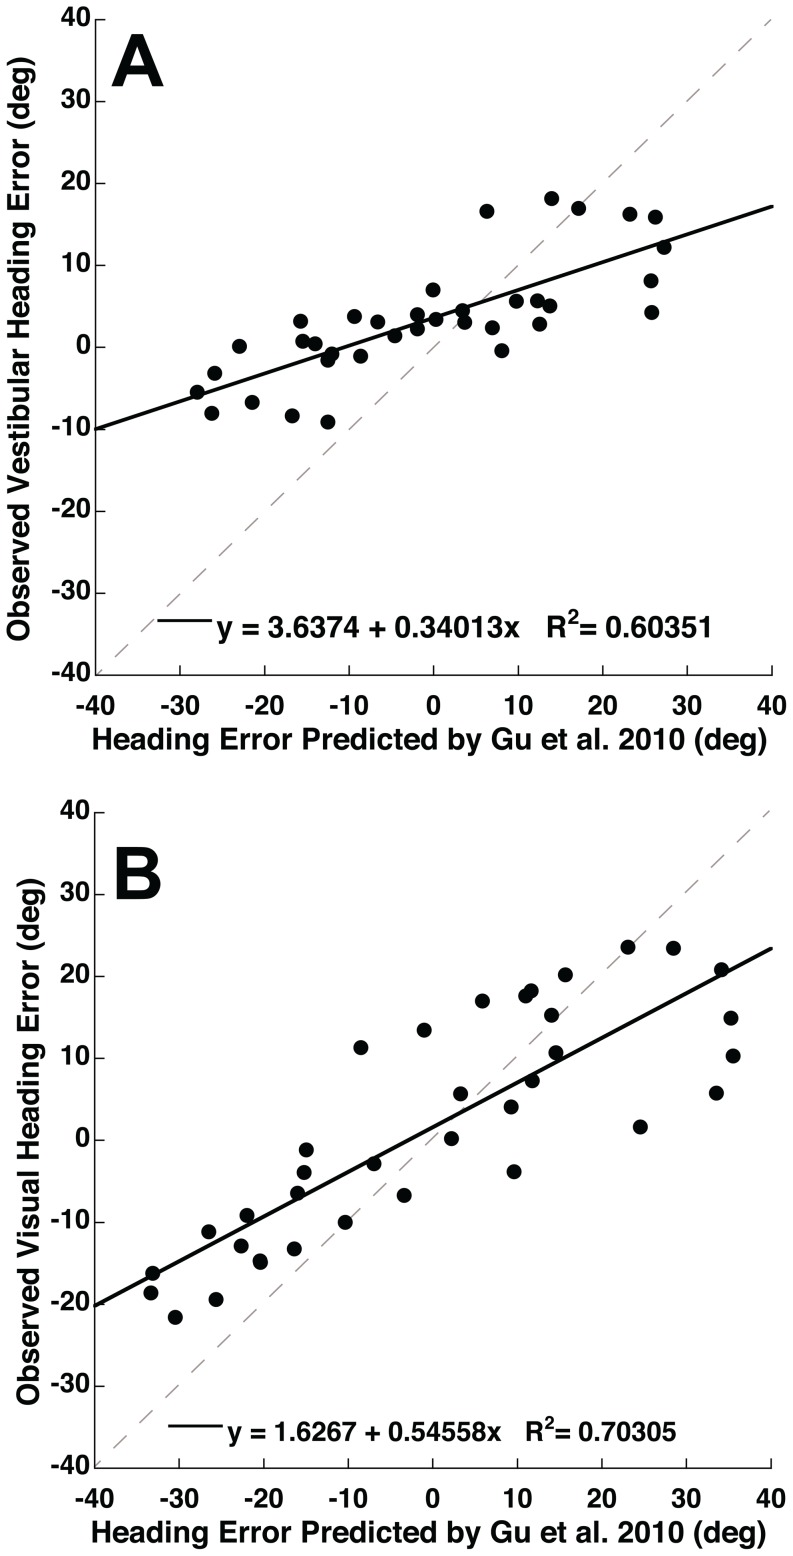
Figure 5. Correlations between the PVD model predictions [29] and experimental observations of heading perception.
The perceived headings were calculated using the method in Fig. 4. The best-fit linear regression is shown as a solid line on each panel. The gray dashed line represents unity. When the heading errors are compared there was a correlation for the vestibular (panel A) and visual (panel B) conditions.

