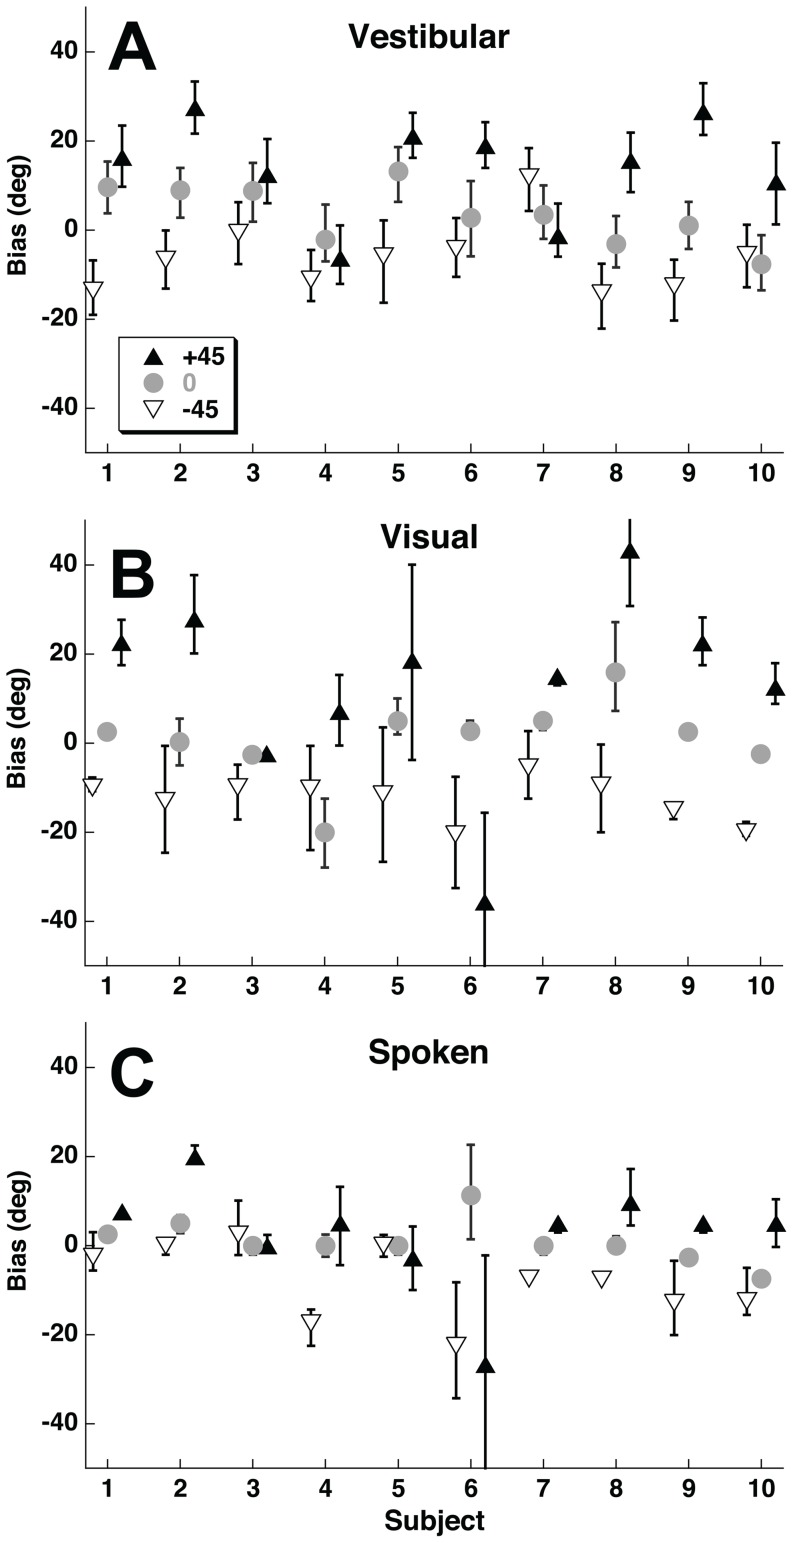
Figure 10. Biases for each subject at the reference headings of −45° (upward pointing filled triangle), 0° (gray circle), and 45° (downward pointing open triangle).
These biases were calculated using the psychometric method shown in Fig. 7. Error bars represent 95% confidence intervals. Panel A: Vestibular headings. Panel B: Visual headings. Panel C: Spoken headings.

