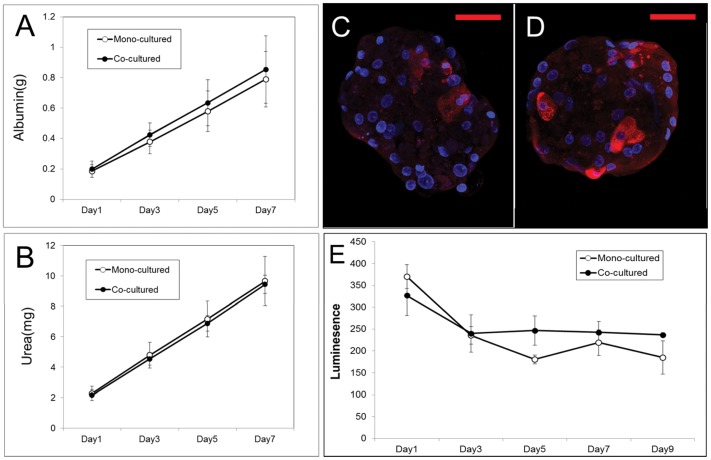
Figure 4. Co-cultured spheroids showed higher liver specific function and more stable metabolic function than mono-cultured spheroids.
Analysis of metabolic function of mono-cultured spheroids and co-cultured spheroids, measured as secretion of (A) albumin and (B) urea. Data represent means ± standard deviations of eight independent experiments. Immunostaining for cytochrome P450 reductase (red) in (C) mono-cultured spheroids and (D) co-cultured spheroids cultured for 9 days. Nuclei were stained with DAPI (blue). Scale bars, 50 µm. (E) Luminescence assay of cytochrome P450 activity in mono-cultured and co-cultured spheroids. Cytochrome P450 3A enzyme activity were measured based on the degree of luminescence emitted by adding detection reagent and measured with a luminometer. Data represent means ± standard deviations of 3 independent experiments.

