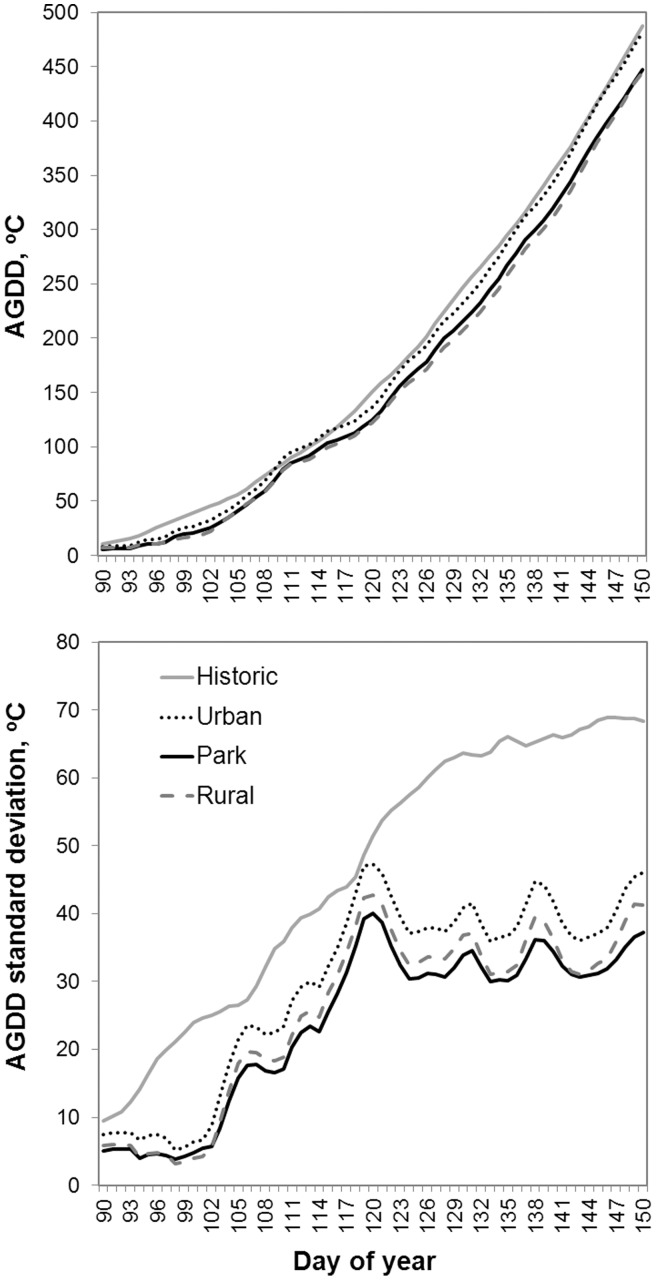
Figure 4. Comparison of mean AGDD (∑>5) accumulation (upper panel) and the associated standard deviation (lower panel) for the period of March,31– May,30.
Historic data is the average of years for which phenology observations are available during 1963–2010, and spatial temperature data is the average of two years (2010–11) shown for three major land uses separately.

