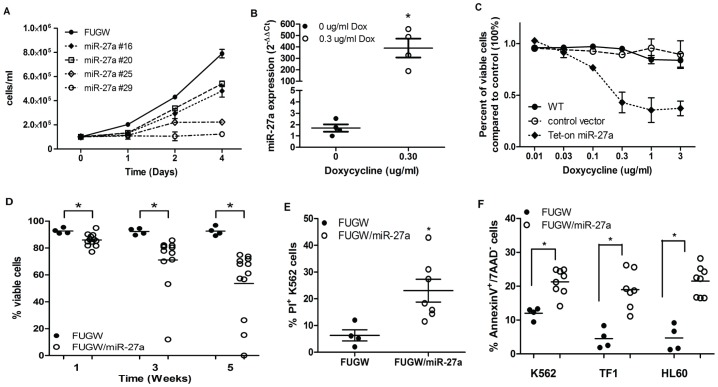
Figure 4. Enforced expression of miR-27a in AMLs.
(A) Effects on proliferation were demonstrated by plating 105 cells/ml in suspension cultures (Day 0) and counting viable cells (via trypan blue exclusion) on Days 1, 2, and 4 (n = 3 per colony). Growth was plotted as the mean viable cell number ±SD. Colony #'s were arbitrary. (B) MiR-27a expression levels in vehicle- and Dox-treated (0.30 µg/ml) TG-27a transduced K562 cells was determined by qRT-PCR and are represented as mean fold expression (2−ΔΔCt) ±SEM. (C) Untransduced K562 cells (WT), K562 cells transduced with a control tet-inducible plasmid, and K562 cells transduced with the TG-27a construct were treated with increasing doses of Dox (as indicated). Cell growth of control- or tet-inducible construct-transduced cells was normalized to that of untransduced K562 cells. (D) Viability of FUGW and FUGW/miR-27a transduced stable K562 clones was measured at indicated times after isolation from methylcellulose colonies. Each data point represents 1 clonal population (i.e. cells grown up from 1 colony and followed over time). Statistical differences in viability over time in FUGW and FUGW/miR-27a K562 colonies were determined by a 1-way ANOVA test (p<0.0001*). (E) FUGW and FUGW/miR-27a K562 clonal populations were stained with PI and FACS-analyzed. Each data point on the graph represents percent PI of an individual clonal population. The mean (±SEM) of FUGW clones (n = 4) was compared to FUGW/miR-27a clones (n = 7), and significant differences were assessed via student's t-test (p<0.05*). (F) K562, TF1, and HL60 AML cells were stained with AnnexinV and 7AAD and FACS-analyzed. Each data point represents the % AnnexinV+/7AAD− population within an individual clone. Significant differences between FUGW and FUGW/miR-27a clones were compared as above.

