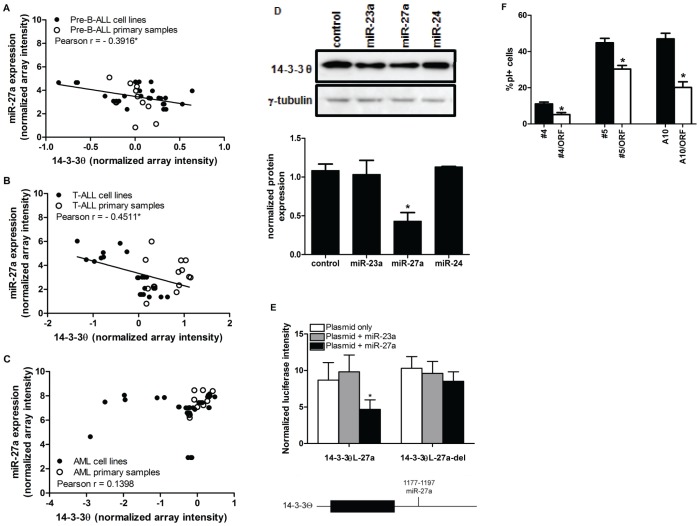
Figure 6. MiR-27a regulates14-3-3θ via a single binding site in the 3′UTR.
(A)–(C) Expression of mature miR-27a and 14-3-3θ mRNA were measured via microarray. Correlation plots of 14-3-3θ and miR-27a expression in (A) pre-B-ALL (n = 37), (B) T-ALL (n = 26), and (C) AML (n = 39) cell lines and primary samples are shown. Significant inverse correlation was determined via Pearson r (r<−0.30, p<0.05*). (D) The effect of miR-27a on 14-3-3θ protein expression was measured via Western blot; the top panel is a representative experiment, and the bottom panel is a graph of normalized protein expression from 3 independent experiments (±SEM), determined by densitometry analysis (p<0.05*). (E) A schematic showing the predicted miR-27a binding site in the 3′UTR of 14-3-3θ (bottom). HEK293T cells were co-transfected with 14-3-3θL-27a or 14-3-3θL-27a-del (500 ng, white bars) alone and with 25 nM of miR-23a (grey bars) or miR-27a (black bars) (top). Normalized mean Luc expression (±SEM) is represented on the graphs. (F) The 14-3-3θ ORF rescues miR-27a-induced cell death. FUGW and FUGW/miR-27a transduced K562 clones were transfected with control plasmid (black bars) or 2 µg 14-3-3θ ORF (white bars), and stained with PI. FUGW/miR-27a transduced clones expressing the 14-3-3θ ORF had significantly less PI+ cells compared to those clones transfected with control vector. Significant differences were determined by Student's t-test (n≥3, p<0.05*).

