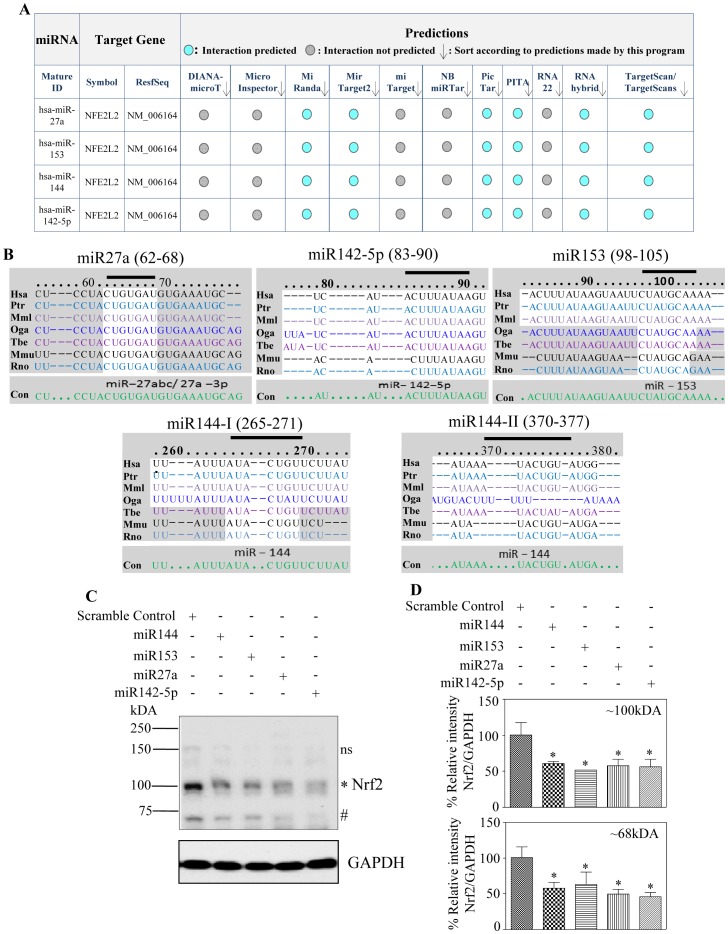
Figure 1. Overexpression of miR144, miR153, miR27a and miR142-5p downregulates Nrf2 protein expression in SH-SY5Y cells.
(A) In-silico bioinformatic algorithm based prediction using “miRecords” to identify different miRs that target human Nrf2 3′ UTR and the top 4 miRs generated by atleast 6 individual databases are listed. (B) Sequence alignment and comparison of evolutionary conservation between different miRNA (miR27a, miR142-5p, miR153, miR144(site1), miR144(site2)) seed sequences and its canonical targeting sequences on human Nrf2 3′-UTRs in cross species. Hsa, human; Ptr, chimpanzee; Mml, rhesus; Oga, bushbaby; Tbe, treeshrew; Mmu, mouse; Rno, rat. The sequences recognized by individual miRNA on human Nrf2 3′ UTR are marked above with a black, bold line. (C) SH-SY5Y cells were transiently transfected with 100 nM each of indicated miR mimics individually for 48 h. Whole cell protein lysates were immunoblotted for Nrf2. GAPDH and tubulin were used for normalization and a representative immunoblot is shown. (D) * and # indicate 100 kDA and 68 kDA Nrf2 bands respectively and ns indicate non-specific bands. Using ImageJ based densitometric analysis, the intensity of 100 kDA and 68 kDA Nrf2 levels were normalized to GAPDH and plotted. Comparison between scramble control miR and indicated miRs were performed using one way ANOVA followed by Newman-Keul’s post-test analysis. Values are means±s.e.m from 4 independent replicates and * indicates significantly different from scramble control miR (p<0.05).

