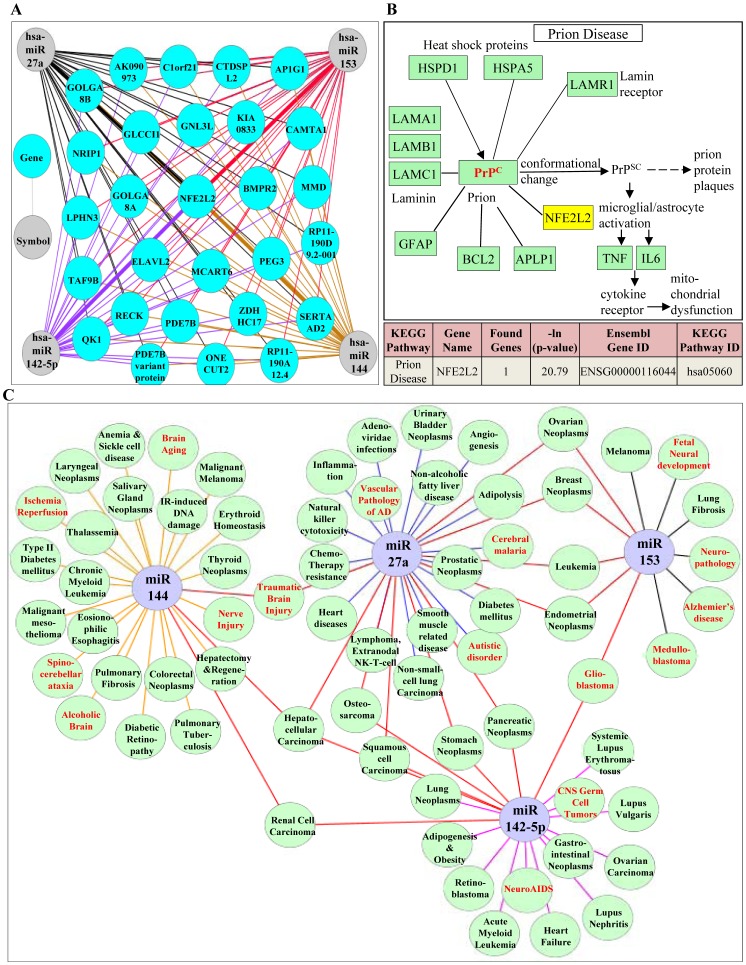
Figure 7. In-silico based identification of Nrf2 dependent molecular pathway and complex network of disease processes that could be regulated at the intersection of miR144, miR153, miR27a and miR142-5p.
(A) “mirDIP” based computational analysis of tested miRs (miR144/153/27a/142-5p) and identification of number of genes that could be potentially targeted at the intersection of the 4 miRs. mirDIP generated list was used as an input file and a network was generated using another bioinformatic program, “Cytoscape_v2.8.2″. NFE2L2, which is at the intersection of 4 miRs is represented by a bold colored lines. While all the other target genes which are at the intersection of 4 miRs are represented by independent colored lines (miR144-brown; miR153-red; miR27a-black; miR142-5p-purple). (B) KEGG pathway mapping identified Prion disease as the predominant pathway at the intersection of miR144, miR153, miR27a, miR142-5p involving NFE2L2, one of the genes that is predicted to be regulated with a high –ln(p-value) of 20.79 by “DIANA-mirPath”. (C) Using the concept of network biology, we constructed miRNA-associated disease network (MDN) to visualize the relationship of miRs of our interest with multiple pathologic/pathogenic conditions. The network was generated by compiling the data manually from Pubmed (till 05/07/2012) along with the information from two other databases, Human miRNA Disease Database (HMDD - http://202.38.126.151/hmdd/mirna/md/) and miR2Disease (http://www.mir2disease.org/). This compiled data was used in “Cytoscape_v2.8.2″ to establish connections between miRs and associated diseases. Different diseases associated with indicated miRs are represented as light green colored nodes. Diseases associated with individual miRs are connected by specific colored edges (lines) and any two different miRs that share one common disease are connected by red colored edge. Neuro specific pathologies are represented in red font.

