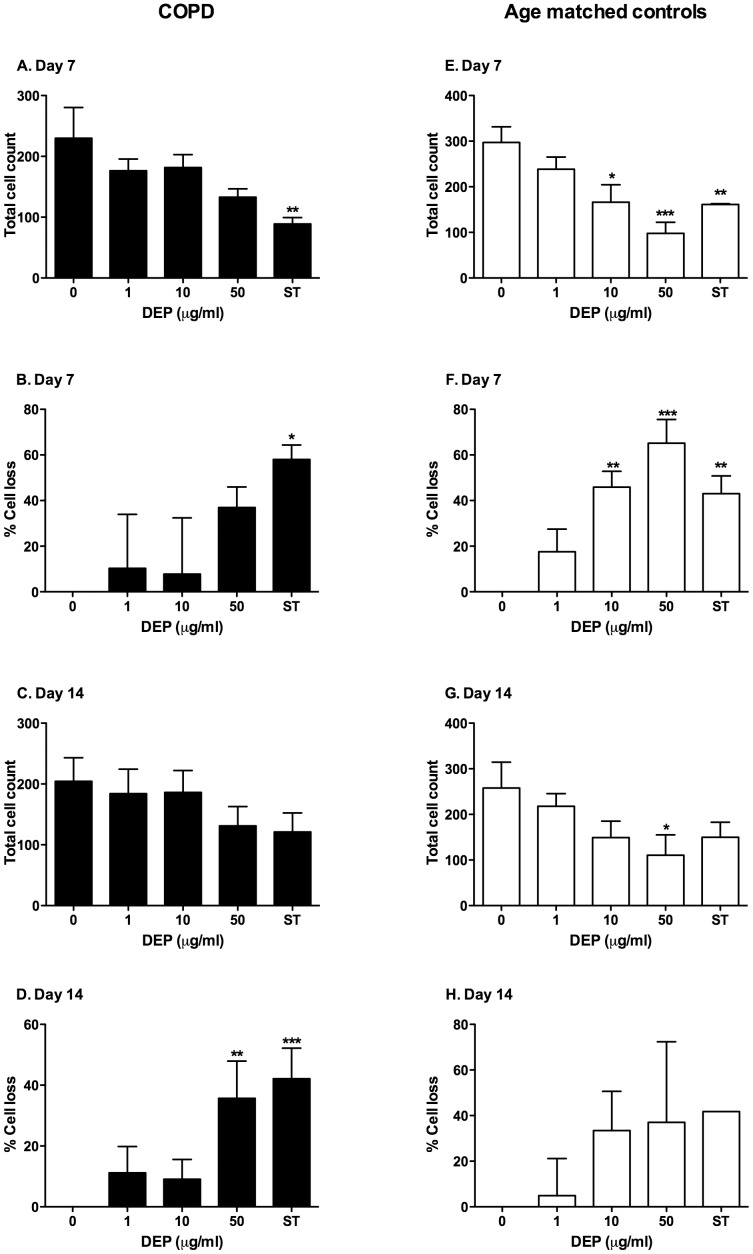
Figure 2. DEP induced cell loss of MDMs from COPD and age matched controls.
MDMs were differentiated from purified monocytes obtained from stage II GOLD criteria COPD and age matched controls in the presence or absence of varied concentrations of DEP as described in the methods. A control well of MDMs was incubated overnight in 1 µM staurosporine (ST). MDMs were visualised by microscopy at the stated time points. A total of 4 randomly selected 40 magnification fields were visualised and cell counts were performed and denoted as total cell count. Data shown are mean±SEM of n = 4, performed on different donors with significant differences denoted by *p<0.05, **p<0.01 and ***p<0.001 compared to MDMs differentiated in the absence of DEP, as measured by one way ANOVA and Dunnett’s post test. To facilitate comparison the percentage cell loss was calculated compared to MDMs differentiated in the absence of DEP.

