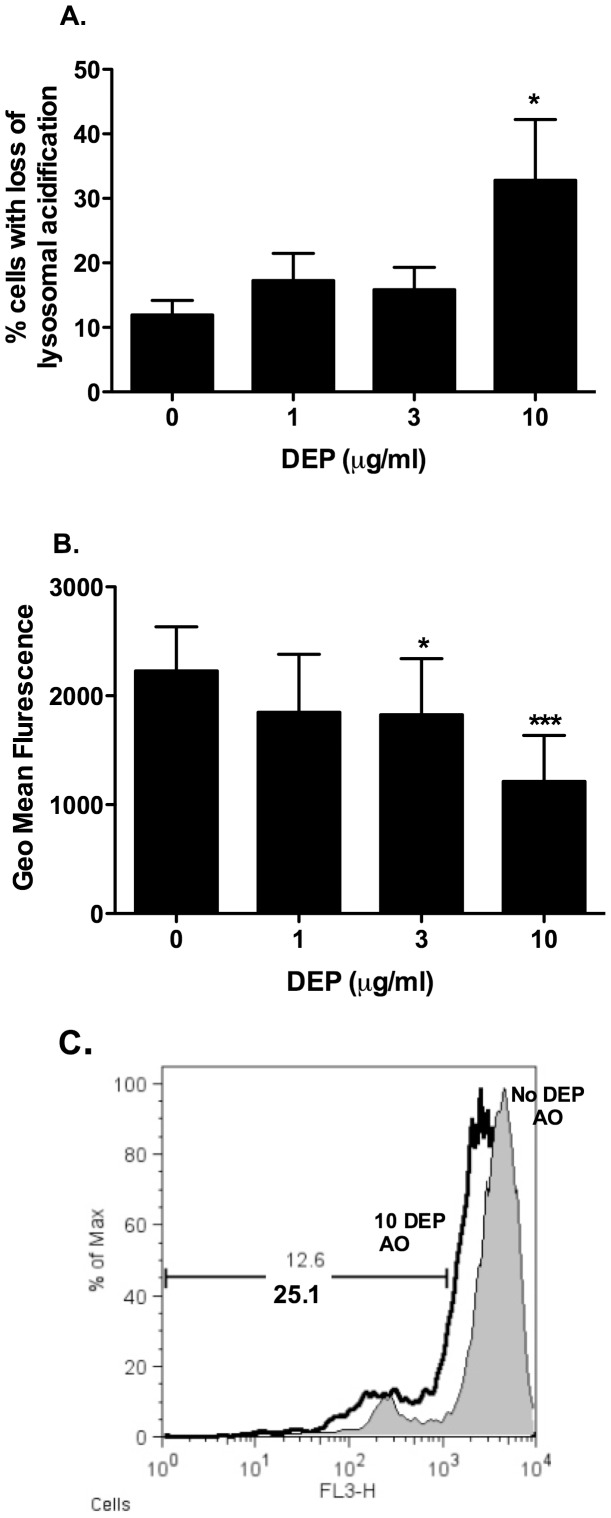
Figure 4. MDMs differentiated in the presence of DEP showed loss of lysosomal acidification.
MDMs were differentiated from purified monocytes in the presence or absence of varied concentrations of DEP as described in the methods. At day 14 cells from healthy volunteers were stained with 5 µM acridine orange (AO) for 30 minutes at 37°C. The cells were harvested and resuspended in ice cold PBS for analysis using a FACSCalibur flow cytometer. Loss of lysosomal acidification was measured in the FL-3 channel. Viable MDMs were identified based on size and granularity on the forward and side scatter plots and ten thousand events were recorded. Data were presented as percentage of cells showing loss of green staining compared to control cells (A) and geomean fluorescence (B) and data analysis was performed using FlowJo software. Figure C shows a representative histogram flow analysis plot from one donor. Data shown are mean±SEM of n = 4–5, performed on different donors with significant differences denoted by *p<0.05, **p<0.01 and ***p<0.001, compared to MDMs differentiated in the absence of DEP, as measured by one way ANOVA and Dunnett’s post test.

