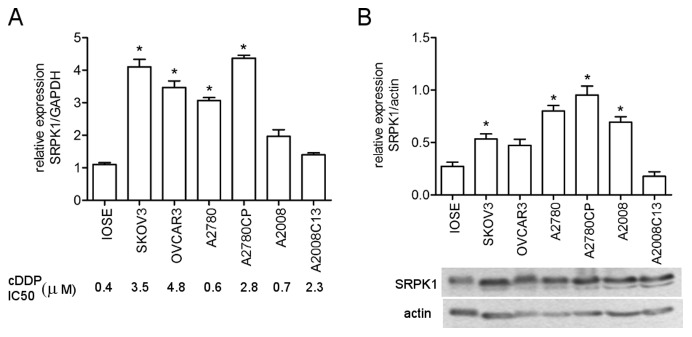
Figure 1. Expression of SRPK1 protein in ovarian cancer cell lines sensitive or resistant to cDDP.
(A) Quantitative real time reverse-transcription polymerase chain reaction (RT-PCR) analysis of SRPK1 RNA level in 6 OVCa cells and IOSE cells. GAPDH was used for loading controls and normalization. Fifty percent growth inhibition concentration (IC50, µM) of cDDP for the OVCa cells was indicated lower panel). (B) Western blot analysis of SRPK1 protein in 6 OVCa cells and IOSE cells. The lower band in the blot probed with anti-SRPK1 antibody is probably proteolytic fragment of SRPK1. The blots were re-probed with actin which was used as a loading control and for normalization. Graph represents relative expression determined by densitometric measurement of the bands and is expressed relative to actin. Bar-graph shown is the average of 4 experiments. Overexpression of SRPK1 in OVCa was defined as greater than 2 fold over the mean of the IOSE samples and is marked with asterisks.

