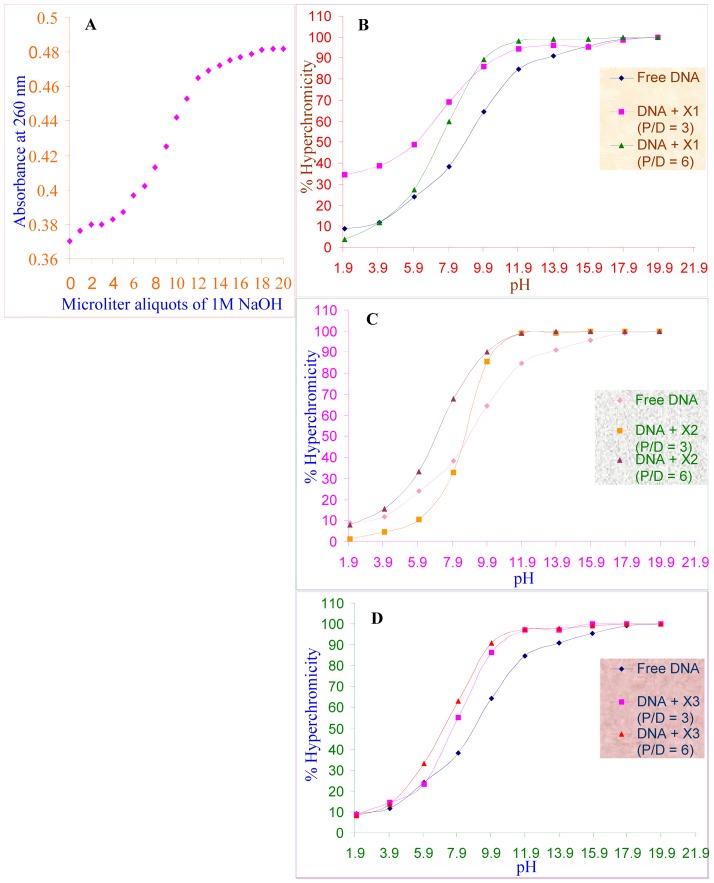
Figure 8. Helix-coil transition analysis, pH melting profile.
(A). pH melting profile of calf thymus DNA in 10 mM NaCl, 25 µM EDTA, produced by adding µl aliquots of 1M NaOH. pH melting curves of calf thymus DNA, which was preincubated with theophylline (X1) (B), theobromine (X2) (C) and Caffeine (X3) (D) at P/D 3 and 6.

