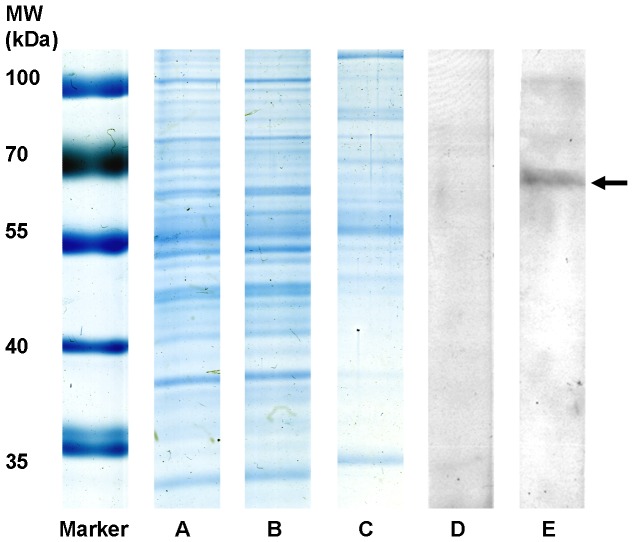
Figure 1. Retinal glycoprotein preparation in 1D SDS-Gel, stained with colloidal Coomassie and in 1D Western blot.
(MW): Molecular weight marker, (A) retinal whole-tissue lysate, untreated, (B) retinal glycoprotein-depleted fraction after lectin affinity chromatography, (C) retinal glycoprotein fraction enriched by lectin affinity. Similar staining patterns of lanes A and B as opposed to different band pattern in lane C indicate a successful enrichment of normally low-abundant glycoproteins. (D) Representative 1D Western blots of glycoprotein-enriched retinal fractions, incubated with healthy control serum showing no reaction to retinal glycoproteins, (E) and incubated with serum of an ERU case that reacted to candidate protein band (arrow).

