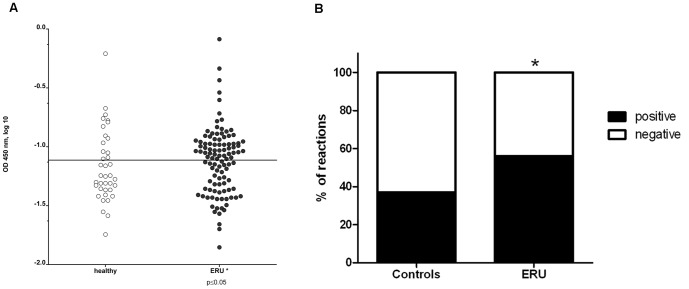
Figure 2. Prevalence of anti Syt1 sera IgG autoantibodies detected by indirect ELISA.
Figure 2A: Anti-synaptotagmin-1 positive IgG in healthy sera (left, white dots) and ERU cases (right, black dots). Each dot represents the absorbance value of an individual serum sample, measured at 450 nm). The Cut-off value was set at the mean value of negative controls plus the 10-fold standard deviation, represented by the horizontal separation line. In ERU samples, anti-Syt1-autoantibodies are more frequently present than in healthy samples (* = p≤0.05). Figure 2B: Comparison of positive reactions (black) and negative reactions (white) in control sera (left bar) and ERU samples (right bar) expressed in per cent. While in controls, the prevalence of positive IgG reactions to Syt1 was 37%, prevalence in the ERU group was 56%. Prevalence in percent was calculated by dividing numbers of positive samples by numbers of tested samples in each group.

