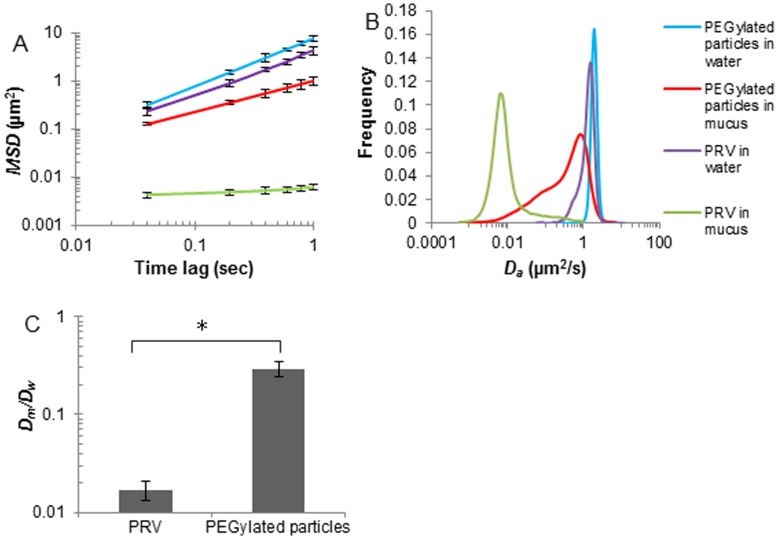
Figure 2. Transport rates of PRV and 200 nm PEGylated nanoparticles in porcine tracheal respiratory mucus or in water.
(A) Averaged ensemble mean squared displacements <MSD> of PRV and 200 nm PEGylated nanoparticles with respect to time scale. Error bars indicate standard errors of the mean. (B) Distributions of the apparent diffusion coefficient of PRV and 200 nm PEGylated nanoparticles. Trajectories of 10 steps were analyzed for each of the 2000 diffusion coefficients. Distributions were refined with MEM. (C) Ratios of the average diffusion coefficients in mucus (Dm) to those in water (Dw). Three independent experiments were performed for each condition. Error bars indicate the standard deviation. The asterisk (*) indicates statistical significance (P<0.005).

